Veja também

 20.04.2026 12:50 AM
Bitcoin continues to show a semblance of an upward move, which has been a correction for two months. This is clearly visible on the daily timeframe. A liquidity pool remains untouched below, which the price is likely to tap with a probability of 90%. We believe that in the near future, market makers may manipulate prices to convince traders that an upward trend has begun. Additionally, Bitcoin may form a sell signal, the first on the daily timeframe in recent months, in the nearest "bearish" FVG.
Meanwhile, MEXC Research analyst Sean Young reported support for Bitcoin from the negotiations between Israel, Iran, and the US. In recent weeks, market sentiment regarding the conflict in the Middle East has become much more optimistic, allowing the first cryptocurrency to rise to 78,000$. Donald Trump announced on Friday that negotiations would resume this weekend. That is today. Previously, the US President has repeatedly talked about the productivity of the negotiations and the real chances of concluding a major agreement with Tehran. How the issue of Iran's nuclear energy will be resolved remains unclear, but the parties are indeed moving towards ending the war and achieving lasting peace.
Sean Young believes that if there are no complications during the negotiations, Bitcoin could easily return to the level of 85,000$ before the end of April. He notes that April is historically positive for Bitcoin. On average, Bitcoin rises by 31% in this month. As of April 19, Bitcoin was up 11%, but in our opinion, the geopolitical factor will not support cryptocurrencies for long. In any case, the current upward movement is a correction. This should be remembered until the technical picture changes to the opposite.
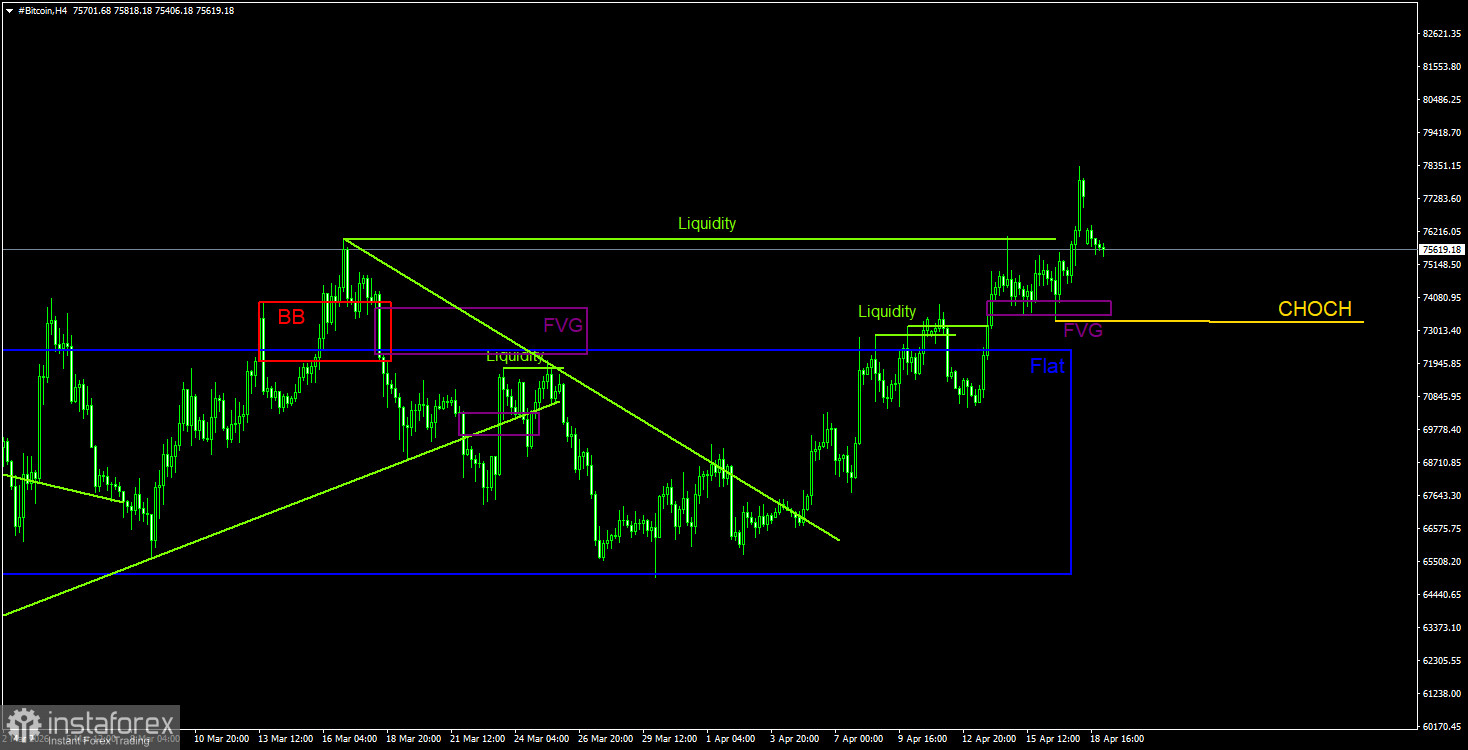
Bitcoin continues to form a full-fledged downward trend and a correction against it. We continue to expect a decline, targeting 57,500$ (the 61.8% level according to Fibonacci from a three-year upward trend), and there are currently no signs of a trend reversal. However, even the 57,500$ level does not appear to be a final stop. Among the areas of interest (POI) at this time, only the nearest bearish FVG on the daily timeframe is notable, located in the area of 79,300$ - 81,200$. On the 4-hour timeframe, local "bullish" patterns can be used for long positions, but it should be remembered that patterns on the daily timeframe are more important, and the correction has already stretched on time. On the 4-hour timeframe, we would advise waiting for a structural break before forming "bearish" patterns and signals.
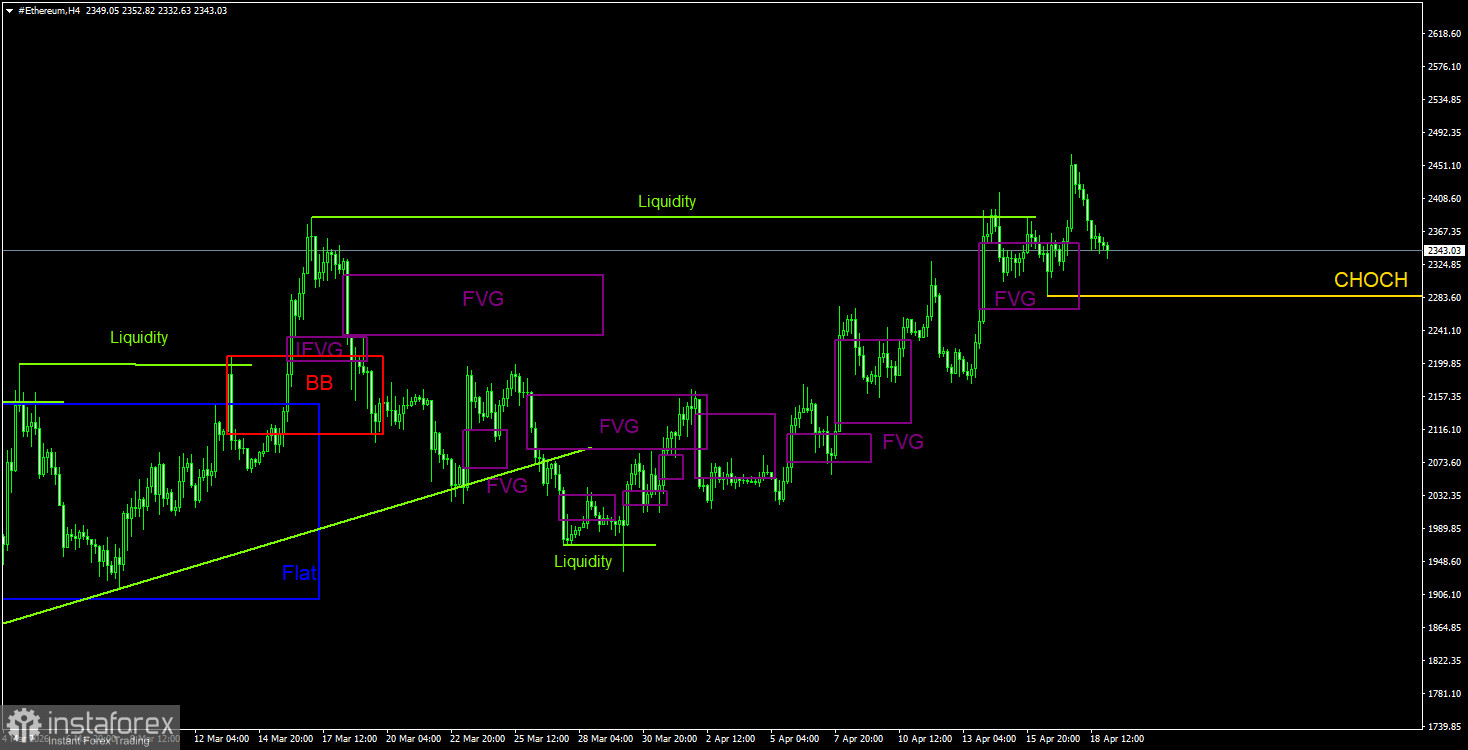
On the daily timeframe, a downward trend and correction against it continue to form. The key sell pattern has been and remains the bearish order block on the weekly timeframe. As we warned, the movement triggered by this signal can be strong and prolonged. After its formation, Ethereum has decreased by 65% or 3,200$. In the near future, Ethereum might continue a weak upward correction, but any correction eventually ends. On the 4-hour timeframe, Ethereum has processed all recent FVGs quite well, but the movements remain weak and corrective. A sell signal might form in the nearest FVG on the daily timeframe. We remind you that a decline in Ethereum requires a decline in Bitcoin, and any signal requires confirmation on a timeframe two stages below the current one.
CHOCH – trend structure break.
Liquidity – the liquidity, Stop Loss of traders that market makers use to build their positions.
FVG – Price Inefficiency Area. The price moves through such areas very quickly, indicating a complete absence of one side in the market. Subsequently, the price tends to return and react to such areas.
IFVG – Inverted Price Inefficiency Area. After returning to such an area, the price does not react to it; it breaks through impulsively, then tests it from the other side.
OB – Order Block. The candle on which the market maker opened a position to take liquidity for the formation of their position in the opposite direction.


