Veja também

 17.06.2026 05:05 AM
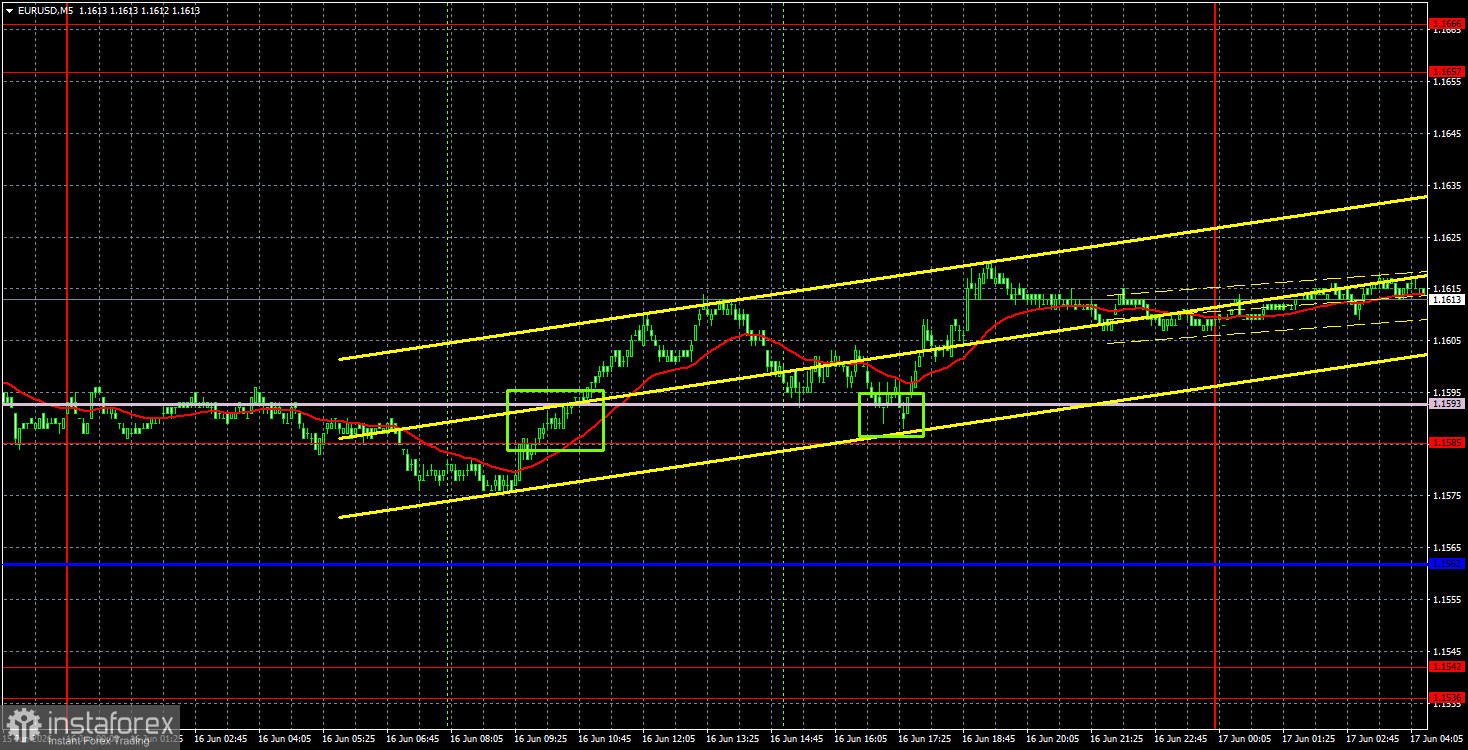
The EUR/USD currency pair traded quietly on Tuesday, with no interesting events. The ongoing deal between Iran and the US continues to stir passions, and an increasing number of experts note that the agreement is essentially meaningless. It will only allow the Strait of Hormuz to be opened for a limited time, but within the next two months, Washington and Tehran must agree on a nuclear deal. There are significant doubts about this point from all parties involved. Moreover, even if the Strait of Hormuz is opened tomorrow, it will take several weeks to months to secure safe passage for ships through it, as the strait has been at least partially mined. Shipowners are in no rush to issue orders to cross the Strait, as they want to ensure that this time the deal between Iran and the US will be signed, not just announced. At least the price of oil has dropped to $80 per barrel, which is a positive development.
From a technical standpoint, the downward trend has been canceled, as the price has surpassed both lines of the Ichimoku indicator. If Tehran and Washington do sign the deal this week, demand for the US currency will decline. However, at this time, the parties have only agreed on the document, and anything can happen before Friday. Uncertainty remains, so the market is not rushing to sell the safe US dollar.
On the 5-minute timeframe on Tuesday, the price formed two buy signals and one sell signal. At the start of the European trading session, the pair settled below 1.1585, but the Kijun-sen line lay below it, making it pointless to open a short position. The price then exceeded the Senkou Span B line, and shortly afterward, it bounced off from above, providing traders with an opportunity to open long positions. Volatility was low once again, preventing traders from profiting from their trades.
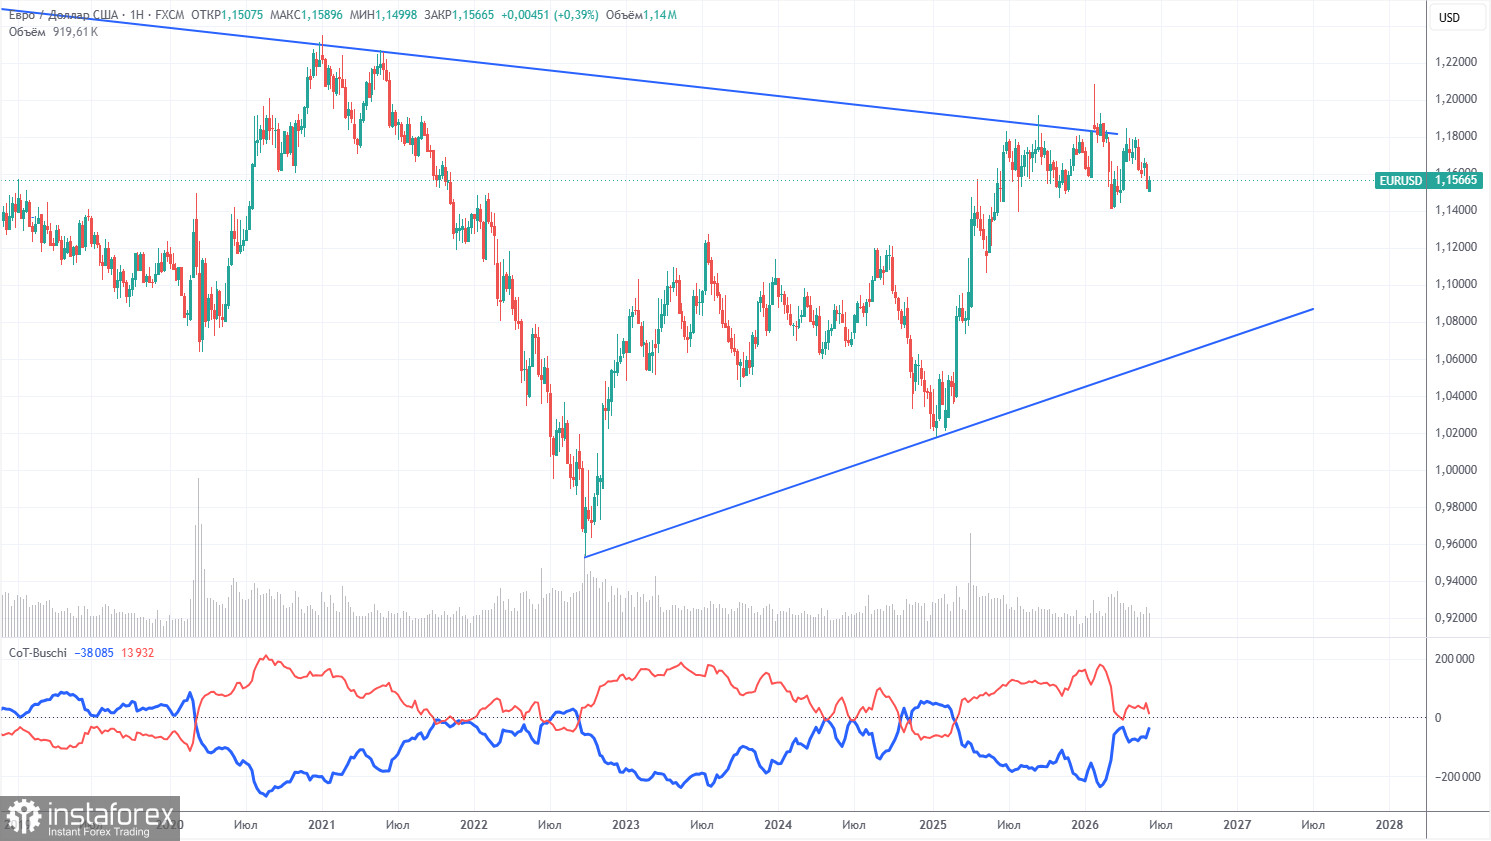
The latest COT report is dated June 9. The illustration on the weekly timeframe clearly shows that the net position of non-commercial traders remains "bullish," but has significantly decreased due to geopolitical events. Traders have been shedding the European currency in favor of the US dollar in recent months. Donald Trump's policies have not changed, but for some time, the dollar has served as a "reserve currency." However, this process may already be complete.
We still do not see any fundamental factors for strengthening the European currency, while there are sufficient factors for the US dollar to decline. The war in the Middle East temporarily made the dollar very attractive, but when this factor reaches its "expiration date," everything will revert to normal. And that date may have already come. In the long term, the euro could fall to as low as $1.08 (the trend line), but the upward trend will still remain relevant. Over the past few months, the pair has not moved significantly closer to this line.
The positioning of the red and blue lines of the indicator indicates parity between bulls and bears. During the last reporting week, the number of long positions in the "Non-commercial" group decreased by 15,900, while the number of shorts increased by 19,000. Consequently, the net position fell by 34,900 contracts over the week.
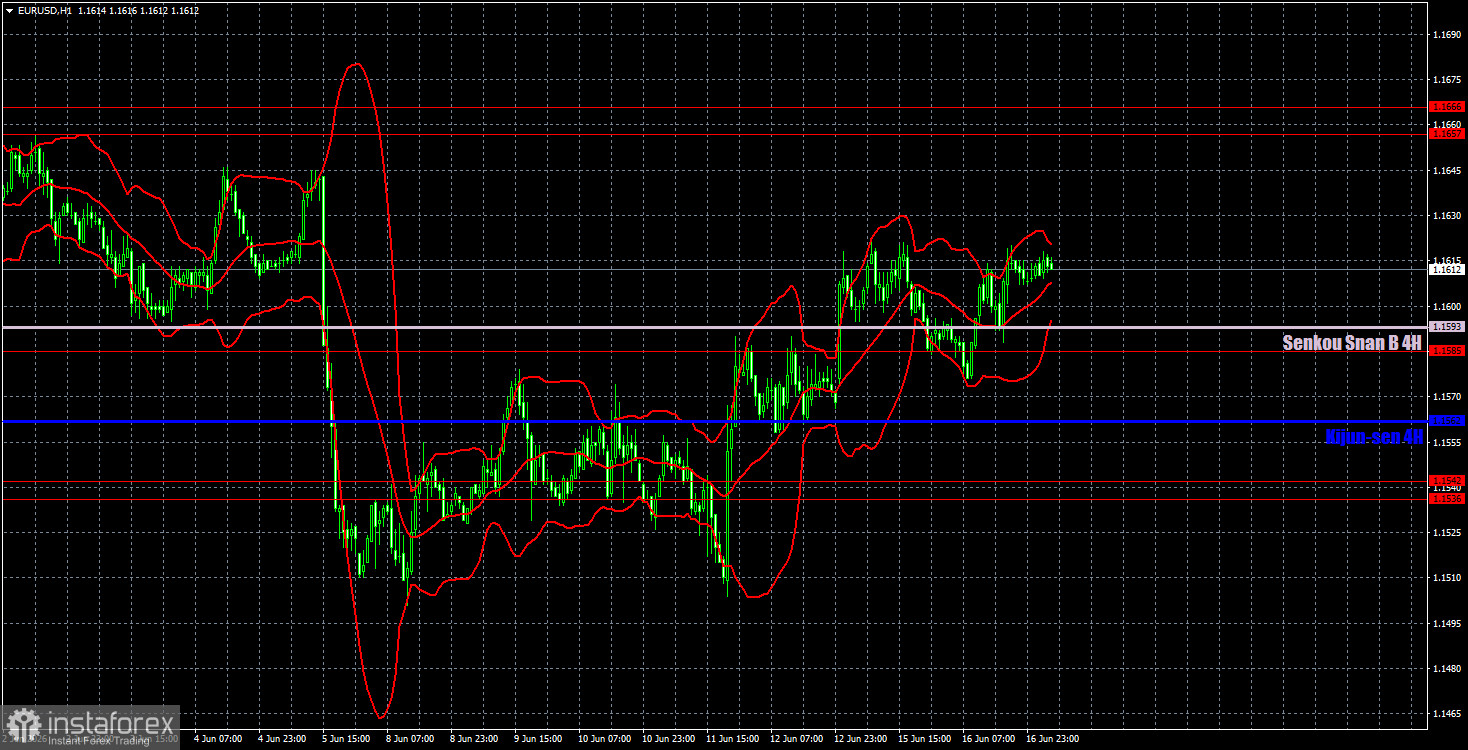
On the hourly timeframe, the EUR/USD pair has broken its downward trend as it has settled above the Senkou Span B line. The situation in the Middle East remains tense, but a full-scale war has not resumed. Thus, there are currently no reasons for the dollar to rise, and the market is not in a hurry to sell the dollar, as it still doubts the ability of Tehran and Washington to not only sign the agreement but also adhere to it.
For June 17, we identify the following trading levels: 1.1362, 1.1426, 1.1536-1.1542, 1.1585, 1.1657-1.1666, 1.1750-1.1760, 1.1786, 1.1830-1.1837, and 1.1907-1.1922, as well as the Senkou Span B line (1.1593) and the Kijun-sen line (1.1562). The Ichimoku indicator lines may shift throughout the day, which should be considered when determining trading signals. Don't forget to set a stop-loss order to break even if the price moves in the right direction by 15 pips. This will protect against potential losses if the signal proves false.
On Wednesday, Christine Lagarde, the President of the European Central Bank, will speak in the European Union, and the Federal Reserve will hold its meeting in the US. We do not believe that the market will react to the ECB President's speech, as it ignored the tightening of the ECB's policy last week. Therefore, all attention will be on the Fed meeting.
Today, traders may consider short positions targeting the 1.1536-1.1542 area if the price settles below 1.1585-1.1593. Long positions can be maintained with a target of 1.1657-1.1666 as long as the price remains above the Senkou Span B line.
Support and resistance price levels (resistance/support) – thick red lines around which movement may end. They are not sources of trading signals.
Kijun-sen and Senkou Span B lines – Ichimoku indicator lines transferred from the 4-hour timeframe to the hourly timeframe. They are strong lines.
Extreme levels – thin red lines from which the price previously rebounded. They are sources of trading signals.
Yellow lines – trend lines, trend channels, and any other technical patterns.
Indicator 1 on COT charts – the size of the net position of each category of traders.


