Veja também

 13.10.2025 09:57 AM
Trend Analysis (Fig. 1)
On Monday, from the level of 1.3355 (the closing price of Friday's daily candle), the market may begin moving downward toward 1.3293 — the historical support level (light blue dashed line). When testing this level, the price may begin to rise toward 1.3323 — the lower fractal (blue dashed line).
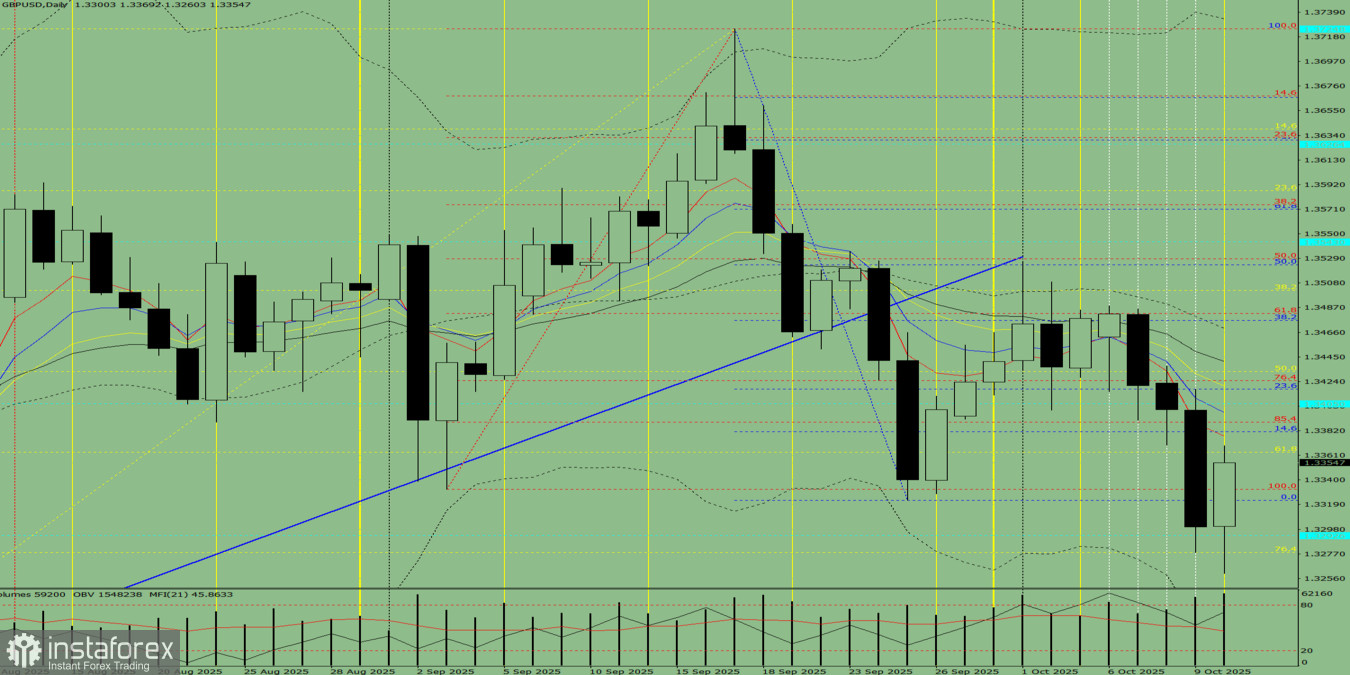
Figure 1: Daily Chart
Comprehensive Analysis
Overall conclusion: downward trend.
Alternative Scenario
From the level of 1.3355 (closing price of Friday's daily candle), the price may begin moving downward toward 1.3278 — the 76.4% retracement level (yellow dashed line). When testing this level, a corrective upward movement may follow, targeting 1.3293 — the historical resistance level (light blue dashed line).
You have already liked this post today
*A análise de mercado aqui postada destina-se a aumentar o seu conhecimento, mas não dar instruções para fazer uma negociação.


