یہ بھی دیکھیں

 22.09.2023 05:49 AM
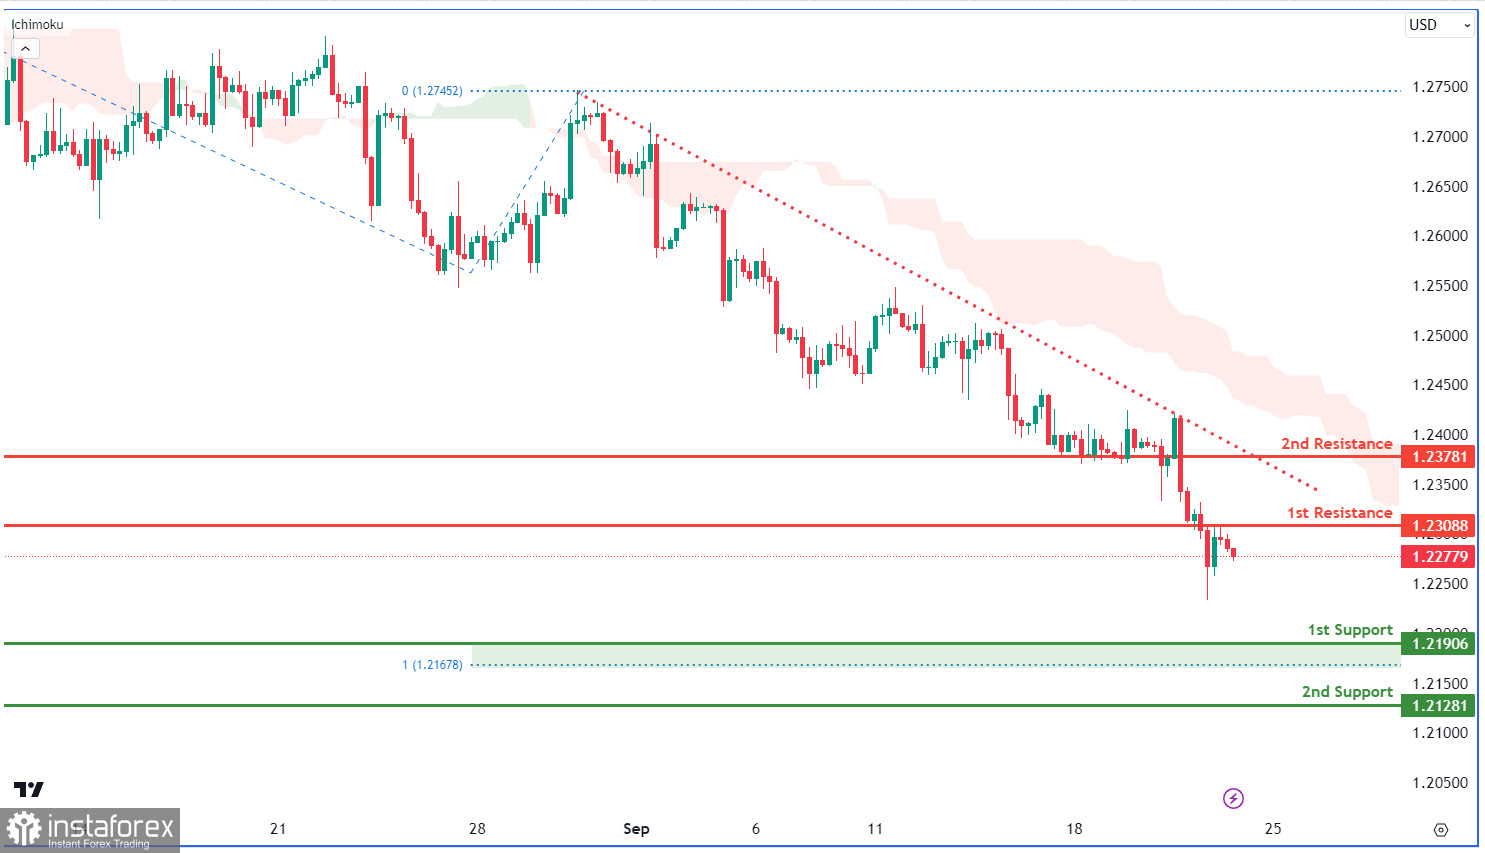
The GBP/USD chart shows a bearish trend, partly due to its position below a descending trend line. The price may move towards the 1st support at 1.219, aligned with the 100% Fibonacci Projection. The 2nd support is at 1.2126, an overlap support. Resistance levels are at 1.2308, an overlap resistance, and 1.2378, a pullback resistance, both serving as potential barriers to upward movement.
You have already liked this post today
*تعینات کیا مراد ہے مارکیٹ کے تجزیات یہاں ارسال کیے جاتے ہیں جس کا مقصد آپ کی بیداری بڑھانا ہے، لیکن تجارت کرنے کے لئے ہدایات دینا نہیں.


