আরও দেখুন

 22.09.2023 05:49 AM
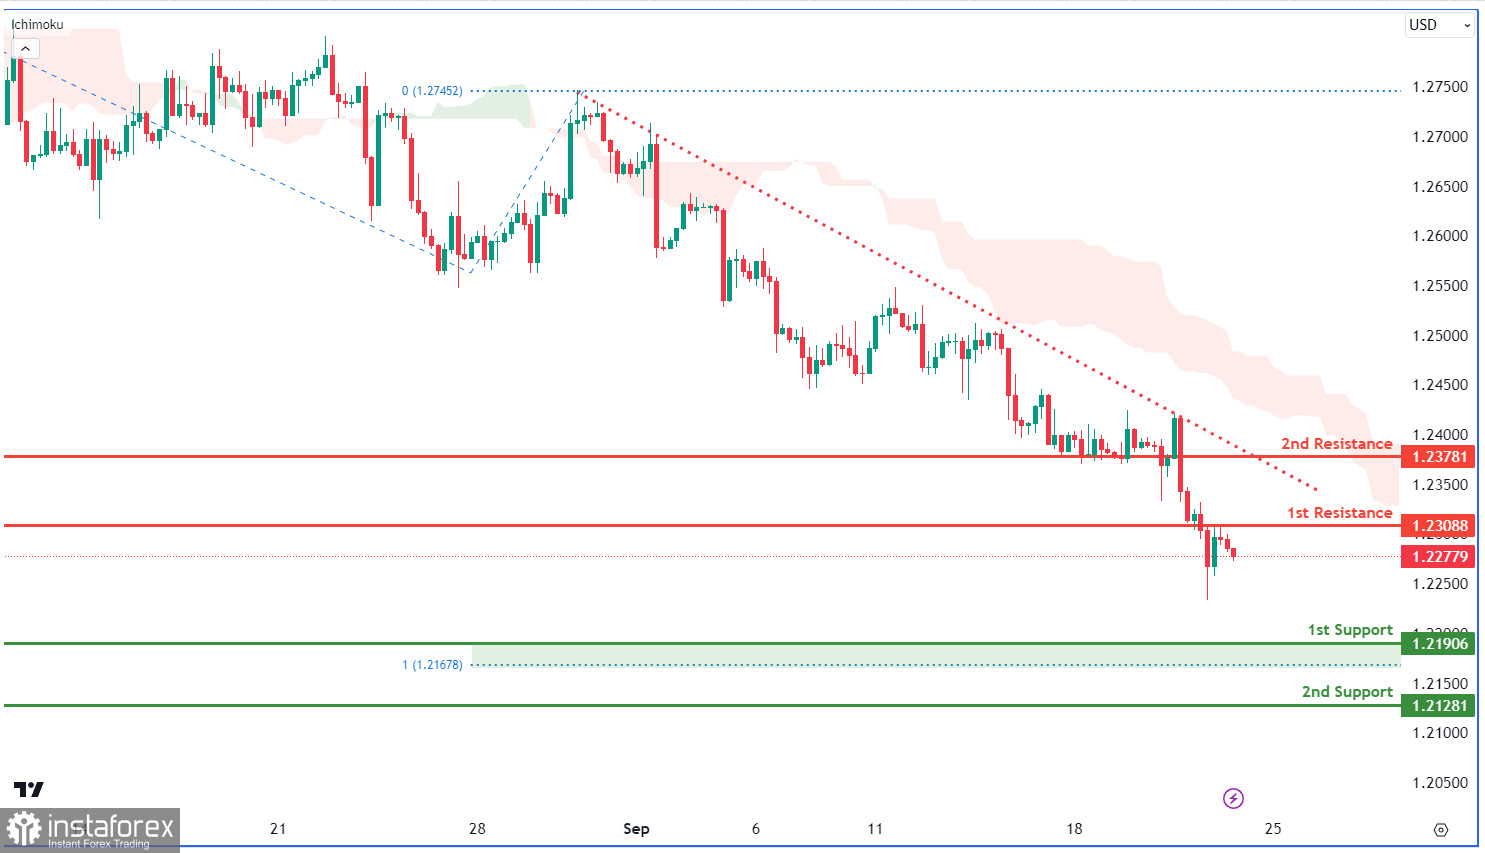
The GBP/USD chart shows a bearish trend, partly due to its position below a descending trend line. The price may move towards the 1st support at 1.219, aligned with the 100% Fibonacci Projection. The 2nd support is at 1.2126, an overlap support. Resistance levels are at 1.2308, an overlap resistance, and 1.2378, a pullback resistance, both serving as potential barriers to upward movement.
You have already liked this post today
*এখানে পোস্ট করা মার্কেট বিশ্লেষণ আপনার সচেতনতা বৃদ্ধির জন্য প্রদান করা হয়, ট্রেড করার নির্দেশনা প্রদানের জন্য প্রদান করা হয় না।


