empty
12.11.2021 11:16 AM
EUR/USD, USD/JPY, GBP/JPY, GOLD simplified wave analysis and forecast on November 12

EUR/USD

Analysis:

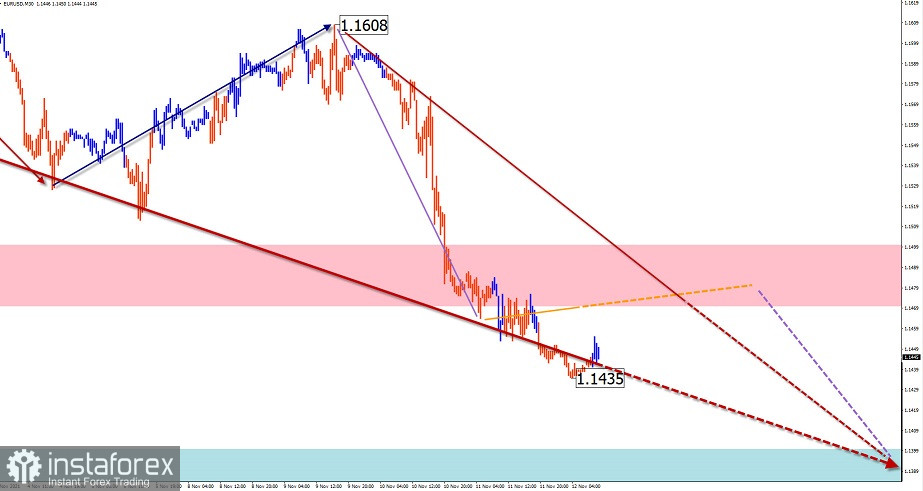
The main direction of the intraday movement of the euro continues to be set by the descending wave from January 6. All counter-movements are within intermediate-term corrections. After breaking through another support, a new section on the main course has started.

Forecast:

A generally flat trading pattern is likely in the coming trading sessions. Short-term price rises are also possible, not beyond the resistance zone. A return to a downtrend is expected at the end of the day or tomorrow.

Potential reversal zones

Resistance:

- 1.1470/1.1500

Support:

- 1.1400/1.1370

Recommendations:

There are no conditions for buying on the euro market today. It is advisable to refrain from entering the market until the completion of the price pullback, with the search for signals to sell the instruments around the calculated resistance.

This image is no longer relevant

USD/JPY

Analysis:

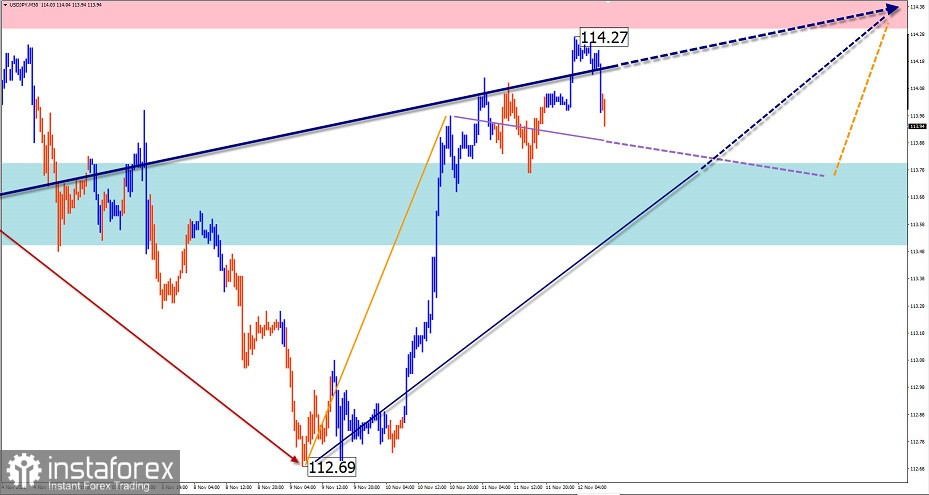
A month-and-a-half-long bearish correction has ended on the Japanese yen major chart. The last leg of the uptrend started on November 9. The price is approaching the lower edge of the wide resistance zone of the upper TF.

Forecast:

In the coming day, the price is expected to move in a narrow range between the opposing zones. After an attempted pressure on the support zone, a change of vector and an upward price move is expected.

Potential reversal zones

Resistance:

- 114.30/114.60

Support:

- 113.80/113.50

Recommendations:

Trading in the Japanese yen market today can be risky. Short-term trades in fractional lots inside the price channel are possible.

This image is no longer relevant

GBP/JPY

Analysis:

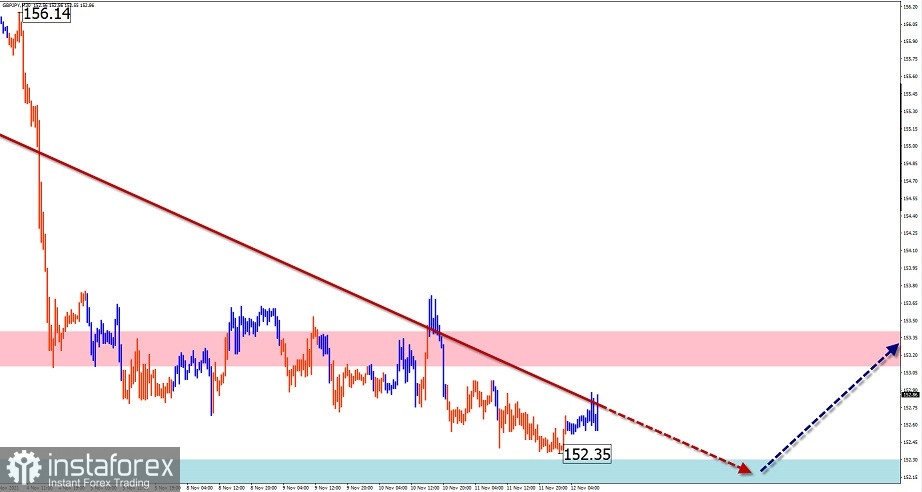
The pound/yen cross continues to move north on the price chart. The price has been forming an intermediate correction from the lower boundary of the strong resistance since October 20. By now the pair has reached a support level.

Forecast:

The general sideways price movement is expected to continue over the next 24 hours. In the second half of the day, after likely pressure on the support zone, a return to an upward vector can be expected, with prices rising towards the resistance zone.

Potential reversal zones

Resistance:

- 153.10/153.40

Support:

- 152.30/152.00

Recommendations:

Trading in this cross pair in the next 24 hours will only be possible in intraday trading with a reduced lot. Buying is more promising today.

This image is no longer relevant

GOLD

Analysis:

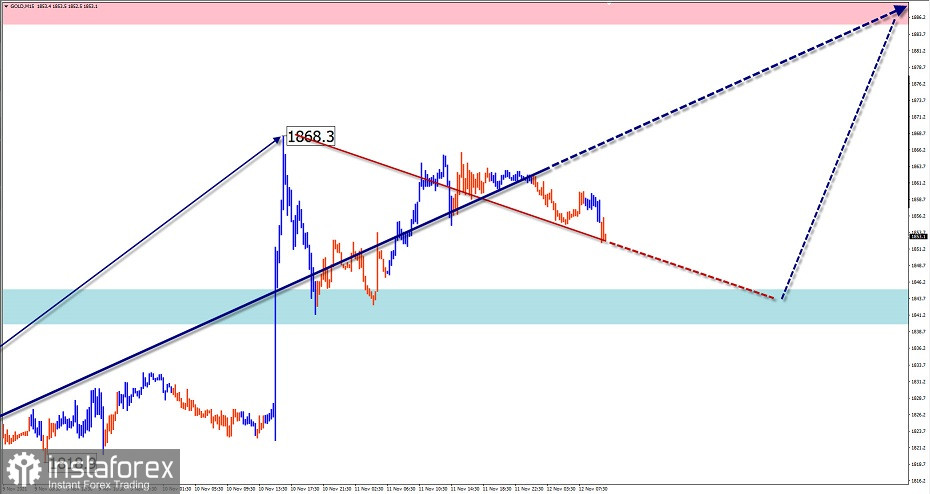
On the gold market, an upward wave has been forming since the end of February. The incomplete portion of the wave dates back to September 30. The gold price is approaching the lower boundary of the potential reversal zone of the senior TF.

Forecast:

Today, the general upward movement is expected to continue. Short-term declines are possible in the European session, but not beyond the support zone. The highest activity is likely by the end of the day.

Potential reversal zones

Resistance:

- 1885.0/1890.0

Support:

- 1845.0/1840.0

Recommendations:

There are no conditions for selling on the gold market today. It is recommended to refrain from entering the instrument until there are clear buying signals around settlement support.

This image is no longer relevant

Explanation: In simplified wave analysis (SVA), waves consist of 3 parts (A-B-C). The last unfinished wave is analysed. The solid arrow background shows the structure formed. The dotted arrow shows the expected movements.

Attention: The wave algorithm does not take into account the duration of the instrument movements over time!

Isabel Clark,
Analytical expert of InstaTrade
© 2007-2025

Recommended Stories

Analyse EUR/USD du 6 novembre 2025

Le motif de vagues sur le graphique de 4 heures pour l'EUR/USD a changé—et malheureusement, pas pour le mieux. Il est encore trop tôt pour conclure que le segment

Chin Zhao 21:01 2025-11-06 UTC+2

Analyse EUR/USD du 5 novembre 2025

La structure des vagues sur le graphique de l'EUR/USD en 4 heures a changé — malheureusement, pas pour le mieux. Il est encore trop tôt pour conclure que le segment

Chin Zhao 18:30 2025-11-05 UTC+2

Analyse de l'EUR/USD le 4 novembre 2025

La structure des vagues sur le graphique de 4 heures pour EUR/USD a changé — malheureusement, pas pour le mieux. Il est encore trop tôt pour conclure que la section

Chin Zhao 18:11 2025-11-04 UTC+2

Analyse de l'EUR/USD le 3 novembre 2025

Le schéma des vagues sur le graphique 4 heures de l'EUR/USD a changé — malheureusement, pas pour le mieux. Il est encore trop tôt pour conclure que le segment

Chin Zhao 17:45 2025-11-03 UTC+2

Analyse GBP/USD du 31 octobre 2025

La structure des vagues du GBP/USD continue d’indiquer la formation d'une tendance haussière, mais au cours des dernières semaines, elle a pris une forme complexe et ambiguë. La livre

Chin Zhao 21:45 2025-10-31 UTC+2

Analyse de l'EUR/USD le 31 octobre 2025

Le schéma des vagues sur le graphique de 4 heures pour l'EUR/USD a changé - malheureusement, pas pour le mieux. Il est encore trop tôt pour conclure que la section

Chin Zhao 21:40 2025-10-31 UTC+2

Analyse GBP/USD du 29 octobre 2025

Le modèle de vague pour la paire GBP/USD continue d'indiquer la formation d'un modèle de vague haussière, mais au cours des dernières semaines, il est devenu complexe et ambigu

Chin Zhao 21:07 2025-10-29 UTC+2

Analyse EUR/USD du 29 octobre 2025

Le modèle de vague sur le graphique de 4 heures pour EUR/USD a été révisé — malheureusement, pas en faveur. Il est encore trop tôt pour conclure que la section

Chin Zhao 20:44 2025-10-29 UTC+2

Analyse EUR/USD du 28 octobre 2025

Le modèle de vague sur le graphique de 4 heures pour EUR/USD a changé — et malheureusement, pas pour le mieux. Il est encore trop tôt pour conclure

Chin Zhao 20:32 2025-10-28 UTC+2

Analyse de l'EUR/USD le 27 octobre 2025

Le motif de vagues sur le graphique de 4 heures pour l'EUR/USD a changé, malheureusement pas pour le mieux. Il est encore trop tôt pour conclure que la section haussière

Chin Zhao 20:36 2025-10-27 UTC+2
Can't speak right now?
Ask your question in the chat.
 

Dear visitor,

Your IP address shows that you are currently located in the USA. If you are a resident of the United States, you are prohibited from using the services of InstaFintech Group including online trading, online transfers, deposit/withdrawal of funds, etc.

If you think you are seeing this message by mistake and your location is not the US, kindly proceed to the website. Otherwise, you must leave the website in order to comply with government restrictions.

Why does your IP address show your location as the USA?

  • - you are using a VPN provided by a hosting company based in the United States;
  • - your IP does not have proper WHOIS records;
  • - an error occurred in the WHOIS geolocation database.

Please confirm whether you are a US resident or not by clicking the relevant button below. If you choose the wrong option, being a US resident, you will not be able to open an account with InstaTrade anyway.

We are sorry for any inconvenience caused by this message.