
See also


 04.09.2026 04:47 AM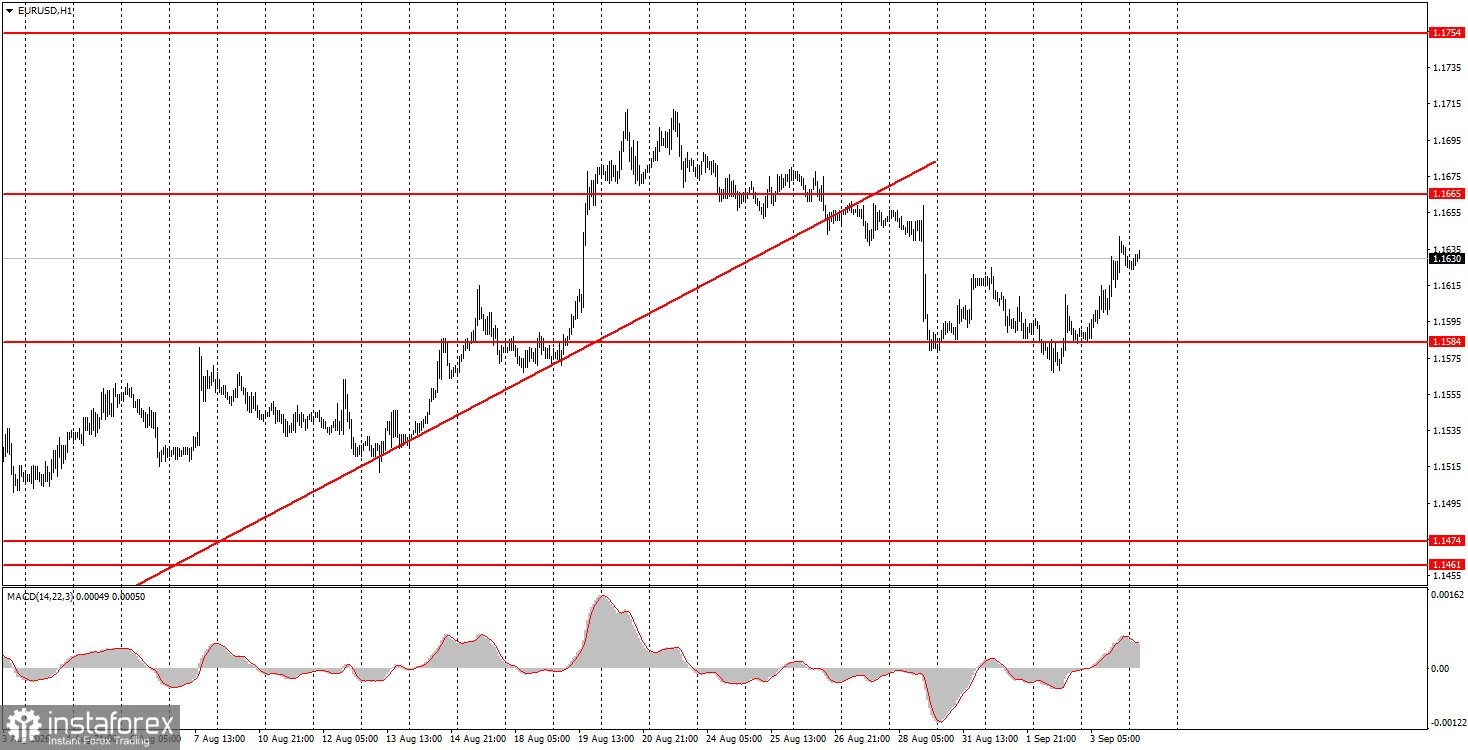
The EUR/USD currency pair rebounded from 1.1584 on Thursday after a two-week correction and is now attempting to resume its upward trend. If you analyze all the macroeconomic releases this week and try to match them with the pair's moves, you will see no correlation. On Monday, Tuesday, and Wednesday, the macro backdrop should have prompted a rise in the US dollar, and on Thursday, a fall. However, in reality, we saw the exact opposite movements. For example, yesterday the US released a fairly good and important ISM services business activity index. It was the first overseas report this week to beat forecasts. Yet the US currency spent the entire day declining. Thus, the conclusion is obvious: the market is not reacting now to news that is not "mega-important." Today, unemployment and Nonfarm Payrolls will be published, and the market should react to reports of that caliber.
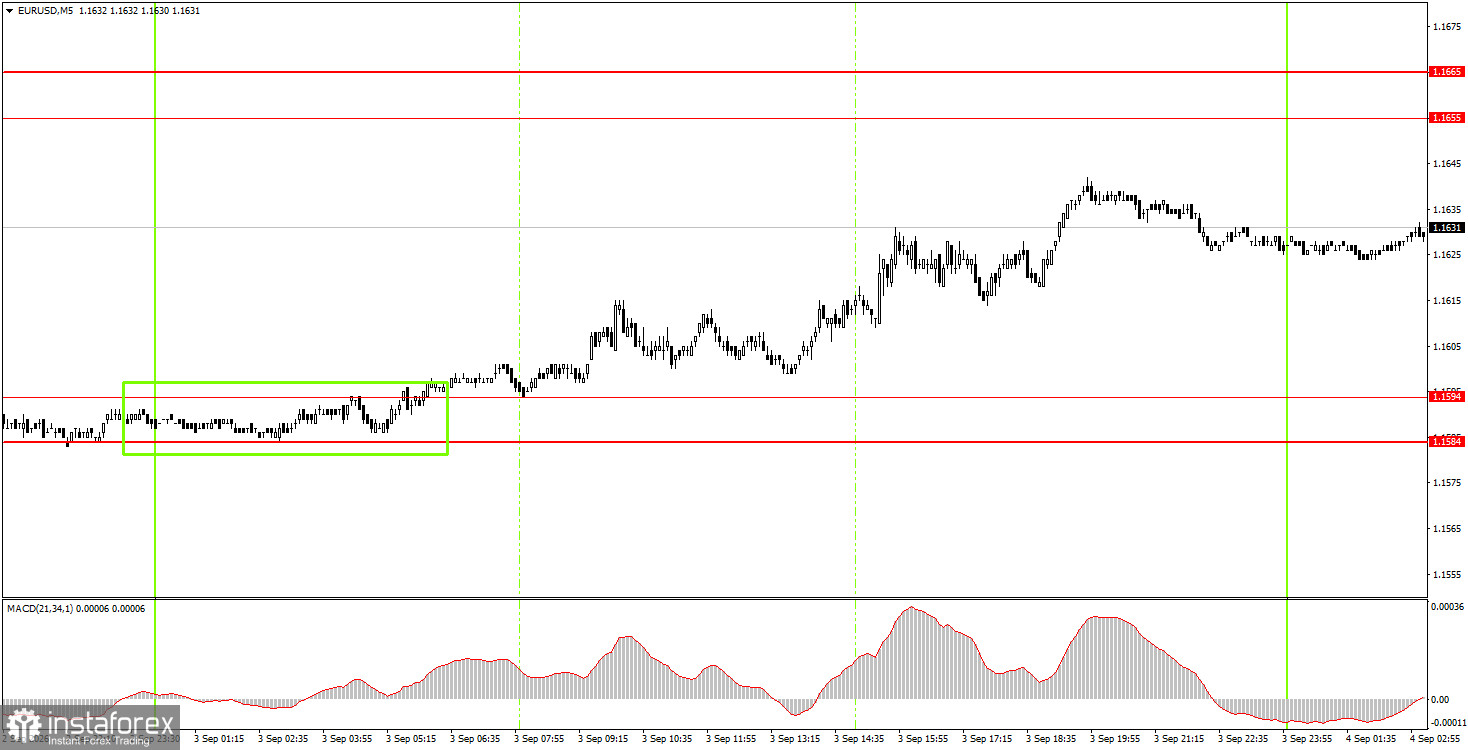
On the 5-minute TF on Thursday, one buy signal formed. At the start of the European session, the price bounced from the 1.1584–1.1594 area, allowing traders to open long positions. Until the end of the day, the pair moved only up, so the trade could have yielded about 25–30 pips of profit.
On the hourly timeframe, the EUR/USD pair continues a correction after a month-long rise. Taking into account all events of recent months, we believe the euro should continue to rise steadily even without local support. The US dollar currently has no growth drivers except the market's almost religious faith in a Federal Reserve rate hike.
On Friday, novice traders may consider short positions targeting 1.1584–1.1594 if the price bounces from the 1.1655–1.1665 area. Longs can be opened if the pair holds above 1.1655–1.1665, with targets at 1.1745–1.1754.
On the 5-minute TF, consider the levels 1.1366–1.1377, 1.1461–1.1474, 1.1527–1.1531, 1.1584–1.1594, 1.1655–1.1665, 1.1745–1.1754, 1.1830–1.1837. On Friday, the EU will publish a retail sales report, and the US will release the crucial Nonfarm Payrolls and unemployment rate. Thus, volatility today may be high.
Price levels (areas) of support and resistance are levels that serve as targets when opening buy or sell trades, or as sources of signals.
Red lines indicate channels or trend lines that illustrate the current trend and show the preferred direction for trading at the moment.
The MACD indicator (14,22,3) — the histogram and signal line — is an auxiliary indicator that can also be used as a source of signals.
Important speeches and reports (contained in the news calendar) can significantly influence the movement of currency pairs. Therefore, during their release, trading should be approached with utmost caution, or traders should exit the market to avoid sudden reversals against the preceding movement.
Beginner forex traders should remember that not every trade can be profitable. Developing a clear strategy and practicing money management are key to long-term success in trading.


