
See also


 23.07.2026 03:35 PM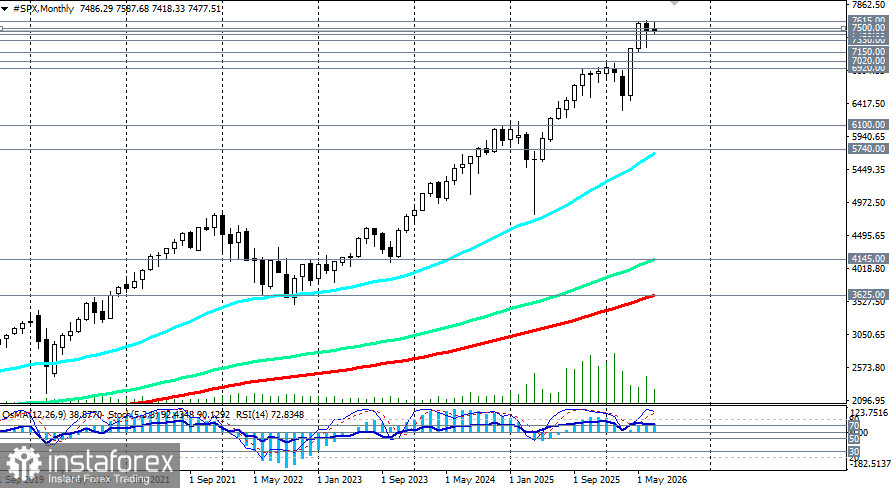
Despite renewed US–Iran tensions, oil rising to five-week highs, and Houthi threats to block the Red Sea, markets have for now "switched off" geopolitics and refocused on strong corporate results and the incoming tech earnings slate.
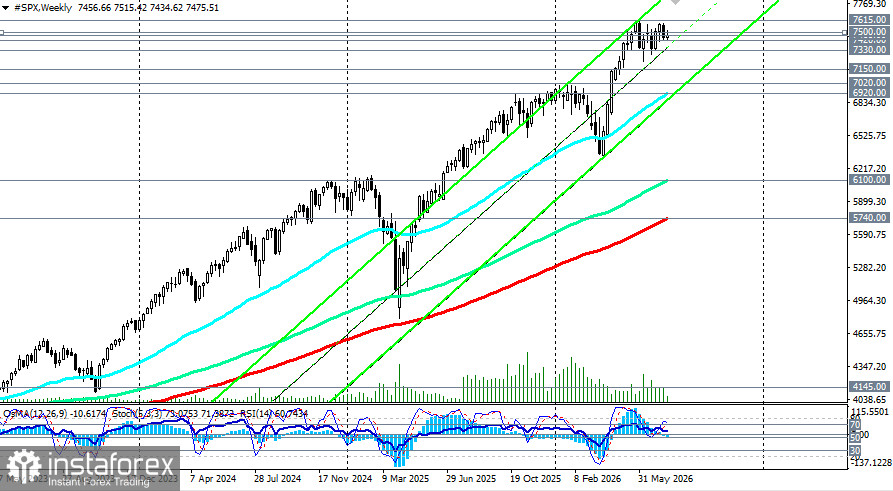
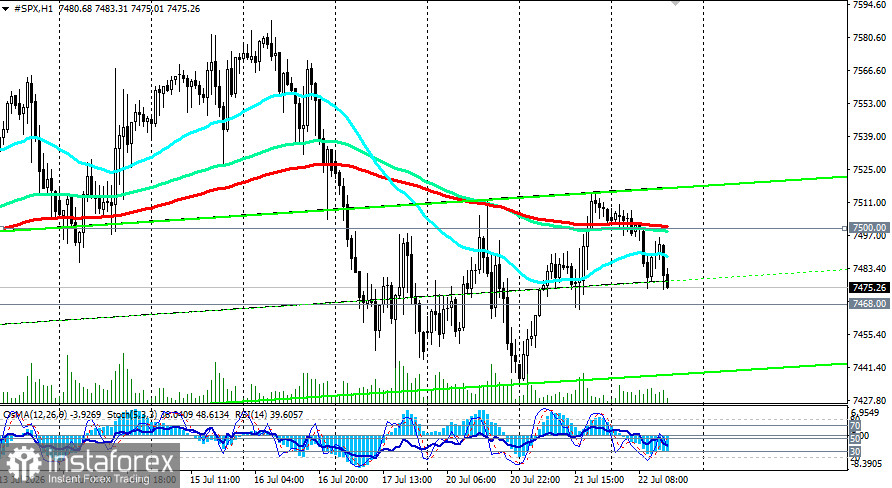
From a technical standpoint, the S&P 500 remains constructive, although indicators give mixed signals:
At the same time, after bouncing from the support level of 7,420.00 and the 50-day EMA, the index is trading above the 200-day EMA (7,020.00), confirming the medium-term uptrend.
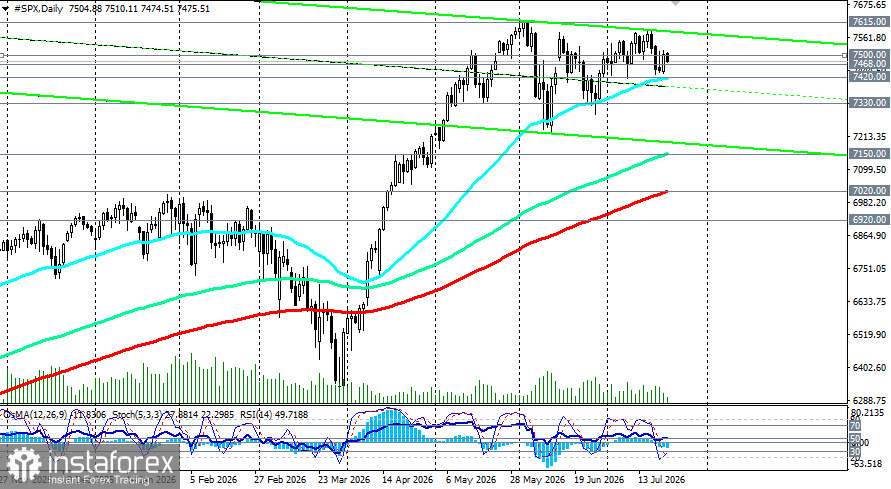
Resistance is located at 7,500.00 (4-hour 50-EMA, 1-hour 200-EMA and a round level) and 7,530.00. A breakout above 7,530.00 with indicator confirmation could open the path to 7,600.00 and 7,700.00.
Conditions
Immediate support sits at 7,468.00 (200-EMA on the 4-hour chart) – 7,420.00 (50-EMA on the daily chart). Further support levels are 7,400.00 (psychological mark) and 7,330.00 (local support).
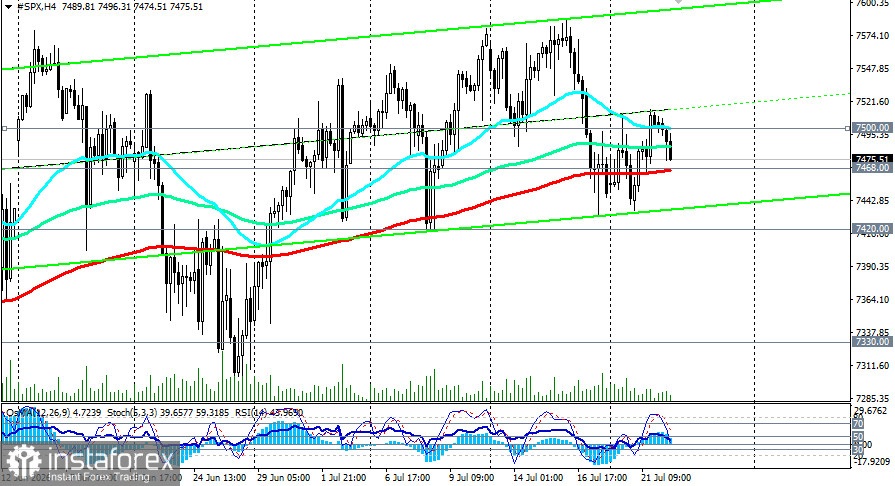
A confirmed break below 7,460.00 would open the way to 7,400.00, leading to an extended decline to 7,300.00 and 7,200.00. Consider pending buy orders in the key zone 7,150.00–7,020.00 (144- and 200-period EMAs on the daily chart) to enter the market at more attractive levels: the global bullish trend of the S&P 500 remains intact.
Conditions for the bullish scenario
Main scenario (base case for 1–2 weeks)
Most likely dynamic — volatile consolidation in the 7,420.00–7,550.00 range with an attempt to break higher if corporate results are strong and geopolitical risks ease.
Rationale
Recommendation — cautious
Prioritize long positions on a confirmed break above 7,550.00. Short positions are appropriate only on a confirmed break below 7,460.00 and supported by fundamental factors.
Trading scenarios
Note: "Targets" correspond to support/resistance levels. They are not guaranteed to be reached but can serve as reference points for planning and order placement.


