See also

 06.04.2026 01:28 PM
Trade Analysis and Tips for Trading the Japanese Yen
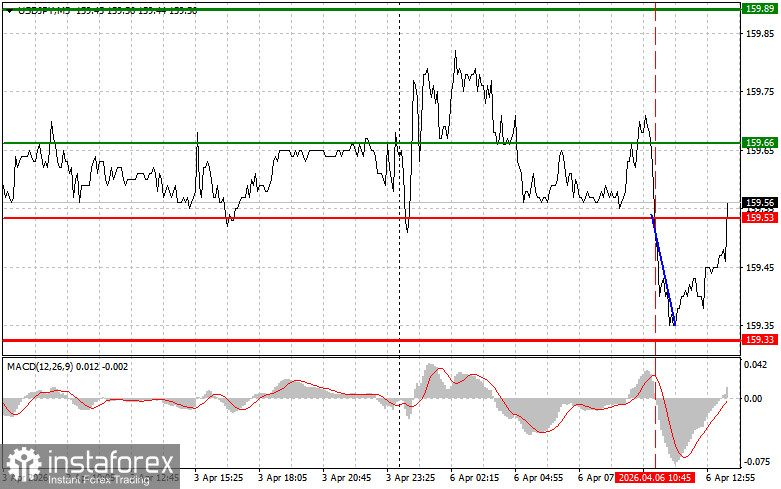
The test of the 159.53 level occurred when the MACD indicator had just begun moving downward from the zero line, confirming a correct entry point for selling the dollar. As a result, the pair almost reached the target level of 159.33.
Today, in the second half of the day, March data for the US ISM Services PMI will be released. Positive results could support the currency pair. If the index comes in below expectations or shows negative dynamics, the opposite reaction is possible. Amid a slowdown in service sector activity, investors may begin revising their outlook for the US economy, which would likely lead to a weakening of the dollar. Such a scenario would create conditions for a decline in USD/JPY. Traders and analysts will also closely monitor the situation in the Middle East, which could have a key impact on risk assets and the US dollar in the coming day. The focus will be on Trump's ultimatum regarding the Strait of Hormuz and US strikes on Iran's energy infrastructure.
As for intraday strategy, I will rely more on implementing Scenarios No. 1 and No. 2.
Buy Signal
Scenario No. 1: I plan to buy USD/JPY today when the price reaches the entry point around 159.55 (green line on the chart), targeting a rise to 159.80 (thicker green line on the chart). Around 159.80, I plan to exit long positions and open short positions in the opposite direction (aiming for a 30–35 point move). Growth today can be expected if US data comes in strong.
Important: Before buying, make sure the MACD indicator is above the zero line and just starting to rise.
Scenario No. 2: I also plan to buy USD/JPY if there are two consecutive tests of the 159.38 level while the MACD indicator is in the oversold zone. This will limit the pair's downward potential and lead to an upward reversal. Growth toward 159.55 and 159.80 can be expected.
Sell Signal
Scenario No. 1: I plan to sell USD/JPY after it breaks below the 159.38 level (red line on the chart), which may lead to a rapid decline. The key target for sellers will be 159.14, where I plan to exit short positions and open long positions in the opposite direction (expecting a 20–25 point move). Pressure on the pair may increase further after weak data.
Important: Before selling, make sure the MACD indicator is below the zero line and just starting to decline.
Scenario No. 2: I also plan to sell USD/JPY if there are two consecutive tests of the 159.55 level while the MACD indicator is in the overbought zone. This will limit the pair's upward potential and lead to a downward reversal. A decline toward 159.38 and 159.14 can be expected.
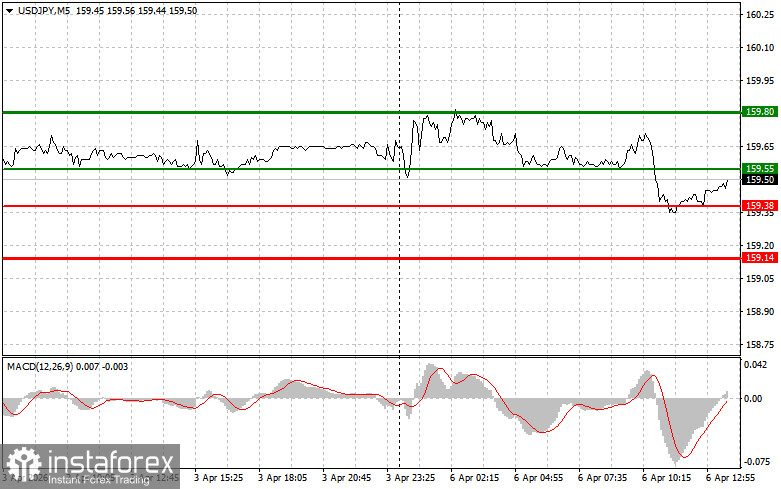
What's on the Chart:
Important Notes for Beginners
Beginner Forex traders should make entry decisions very carefully. Before major fundamental reports are released, it is best to stay out of the market to avoid sharp price fluctuations. If you decide to trade during news releases, always place stop-loss orders to minimize losses. Without stop-losses, you can quickly lose your entire deposit—especially if you do not use proper money management and trade large volumes.
Remember, successful trading requires a clear trading plan, like the one outlined above. Making spontaneous decisions based on current market conditions is a losing strategy for an intraday trader.


