See also

 12.03.2026 12:08 PM
The EUR/USD pair continued its decline throughout Wednesday and consolidated below the 100.0% corrective level at 1.1577. Therefore, the downward movement may continue toward the next Fibonacci level of 127.2% at 1.1440. If the pair closes above 1.1577, it would favor the euro and the resumption of growth toward the 76.4% corrective level at 1.1696.
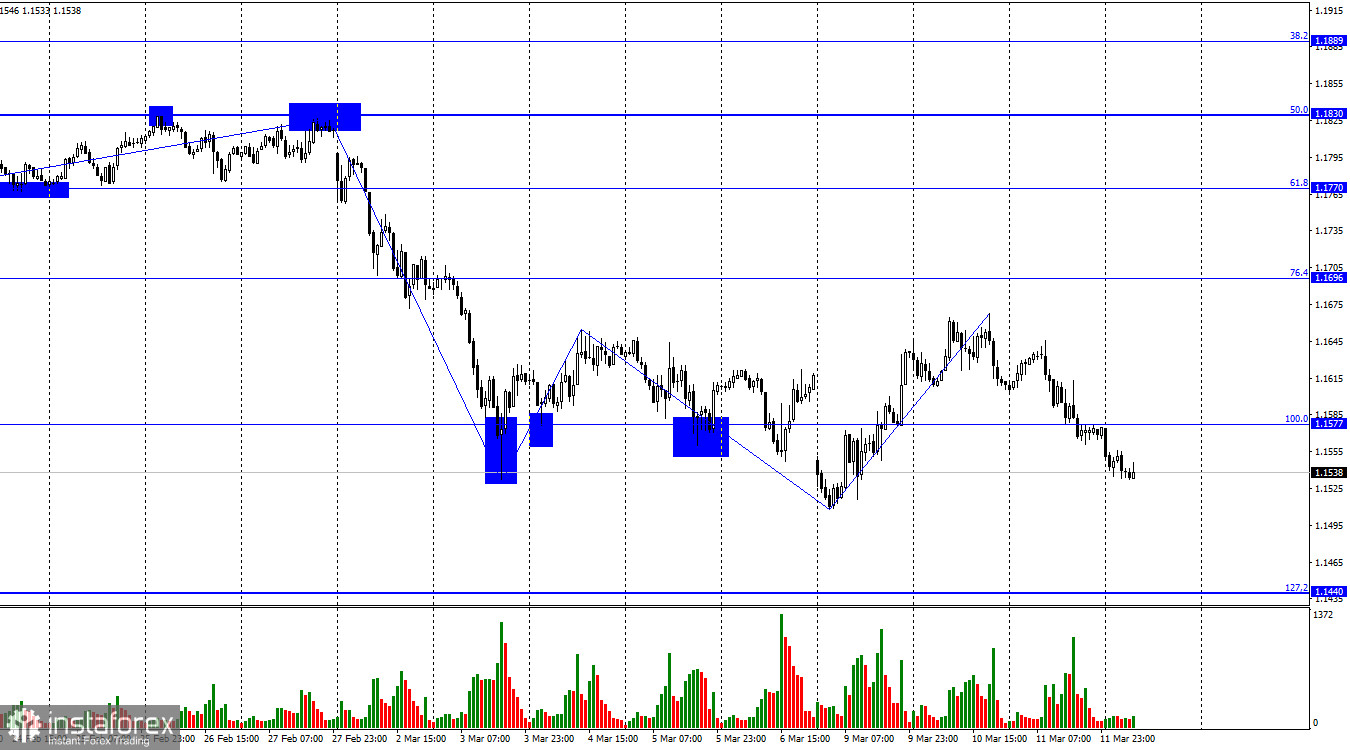
The wave structure on the hourly chart remains clear. The most recently completed downward wave broke the low of the previous wave, while the most recent upward wave exceeded the previous peak by only a few pips. Thus, the trend may currently be in the early stage of changing to a bullish one. The actions of Donald Trump in the Middle East triggered large-scale military operations involving about a dozen countries, which have allowed the U.S. dollar to strengthen as a safe-haven currency.
On Wednesday, the news background once again worsened significantly for all currencies other than the dollar. It became known that Iran does not intend to lift the blockade of the Strait of Hormuz and is also ready to attack any tankers that attempt to pass through it. Therefore, Trump's statements about the war in Iran ending soon have no real basis.
Of course, we do not know the White House's next steps, but Tehran's rhetoric remains aggressive. During the night, it carried out new ballistic strikes against U.S. allies in the region and also attacked three tankers in the Persian Gulf. The price of Brent crude oil once again rose above $100, while Tehran warned that the price of a barrel of oil could reach $200.
Thus, the situation is not improving over time. Sellers have regained momentum and launched a new wave of pressure on the market. Traders should closely monitor news from Tehran and the White House, as well as developments in the Persian Gulf and across the Middle East. At the moment, each of these events has a greater impact on the currency market than economic reports or central bank actions.
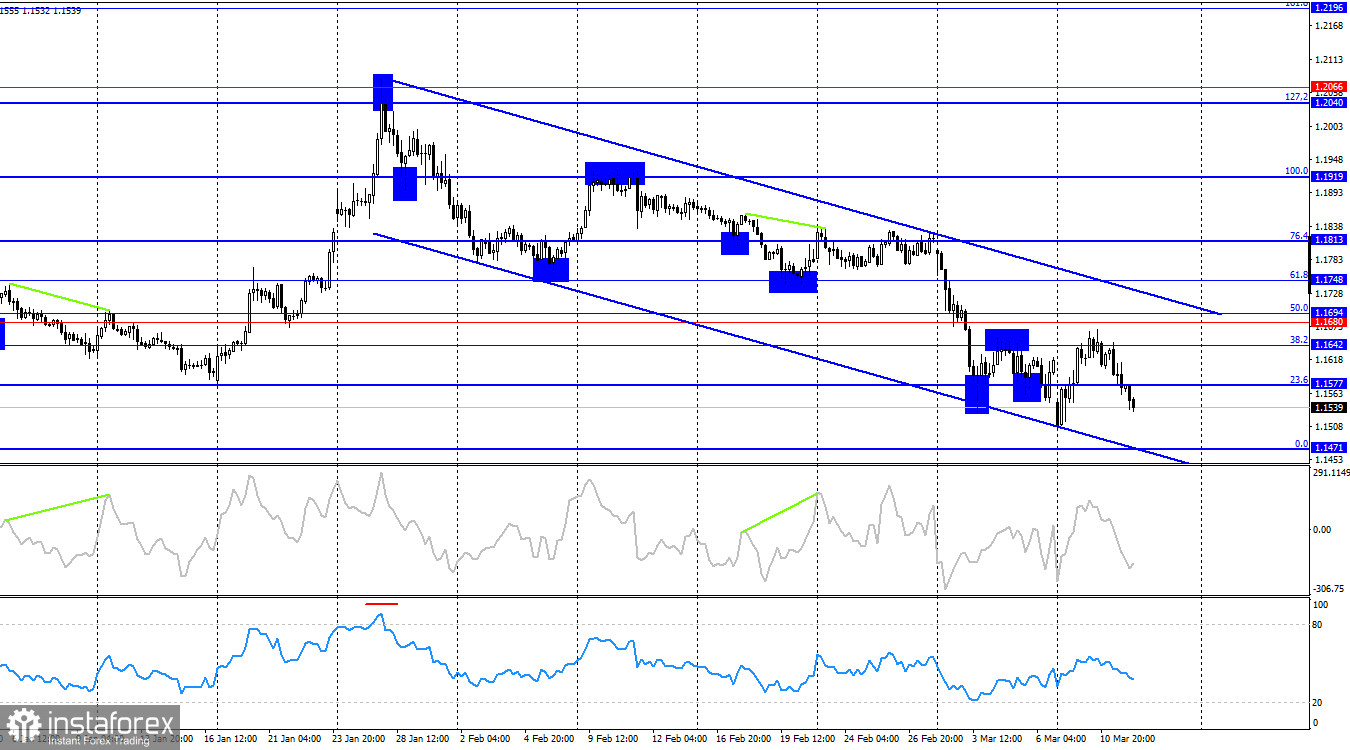
On the 4-hour chart, the pair rebounded from the 38.2% Fibonacci level at 1.1642, reversed in favor of the U.S. dollar, and resumed its decline toward the 0.0% corrective level at 1.1471. The descending trend channel continues to indicate strong dominance by sellers. No new emerging divergences are observed on any indicators.
Commitments of Traders (COT) Report
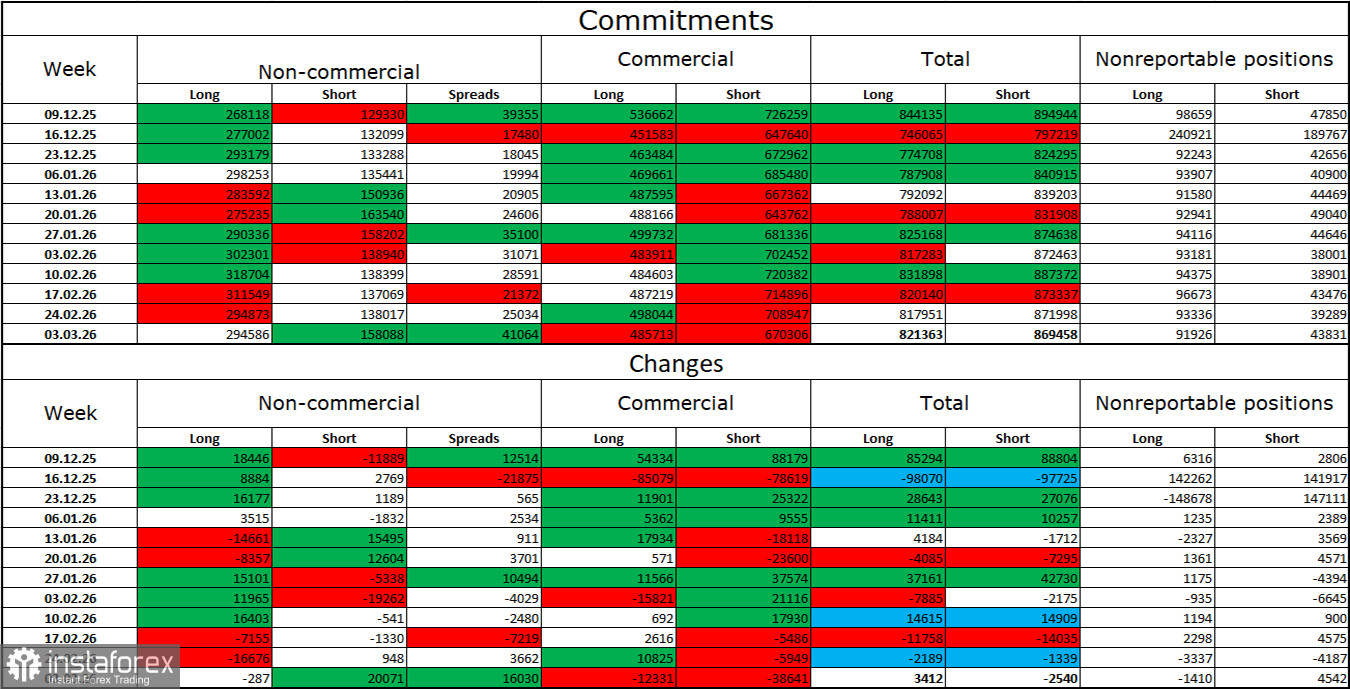
During the latest reporting week, professional traders closed 287 long positions and opened 20,071 short positions. The sentiment of the non-commercial group remains bullish overall due to Donald Trump and his policies, but in recent weeks we have seen a reduction in long positions.
The total number of long positions held by speculators is currently 294,000, while short positions amount to 158,000. The advantage of buyers remains almost twofold.
Overall, in the long term, large market participants continue to reduce short positions and increase long positions. However, global events—of which there have been many in recent years—have a strong influence on investors. At present, the market's attention is focused on the Middle East, where the war continues to intensify and expand geographically.
Therefore, in the near future, the exchange rate of the euro and the U.S. dollar will depend not on Federal Reserve monetary policy or economic data, but on the war in Iran.
Economic Calendar (U.S. and Eurozone)
United States:
On March 12, the economic calendar contains three entries, none of which are considered particularly important. As a result, the impact of economic news on market sentiment on Thursday may be extremely limited.
EUR/USD Forecast and Trading Advice
Selling the pair was possible after a close below 1.1577 with a target of 1.1440. These positions can remain open today. Buy positions may be considered if the price consolidates above 1.1577, with a target of 1.1696.
Fibonacci levels are drawn from 1.1805–1.1578 on the hourly chart and 1.1919–1.1471 on the 4-hour chart.


