See also

 29.12.2025 05:41 PM
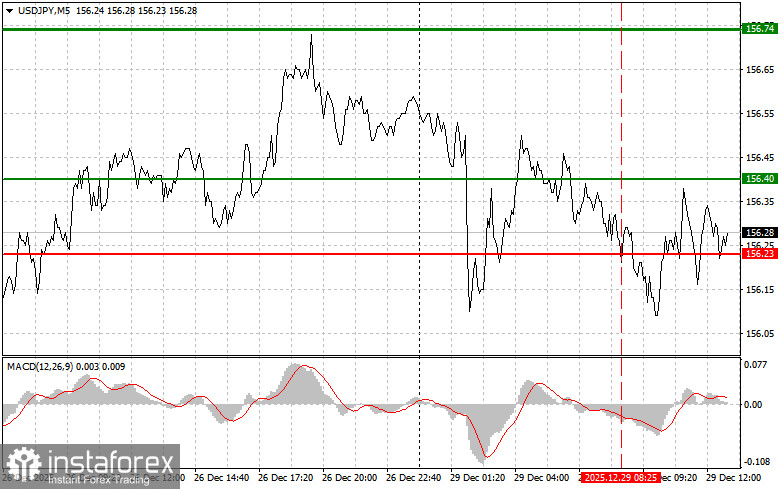
The test of the 156.23 price level occurred when the MACD indicator had already moved significantly downward from the zero line, which limited the downward potential of the pair. For this reason, I did not sell the dollar.
In the second half of the day, a report on the number of pending home sales in the U.S. housing market will be released. This indicator is usually considered a leading signal of activity in the housing sector, showing the number of signed contracts for home purchases that are awaiting completion. Experts closely monitor it to assess the current health and future trends of the real estate market. A result above forecasts may trigger a rise in the U.S. dollar and a weakening of the Japanese yen. Conversely, weaker data may put downward pressure on the U.S. currency. However, any impact from the report is likely to be short-lived given the approaching holidays. Nevertheless, short-term fluctuations in the USD/JPY exchange rate are quite possible.
As for the intraday strategy, I will rely more on the implementation of scenarios No. 1 and No. 2.
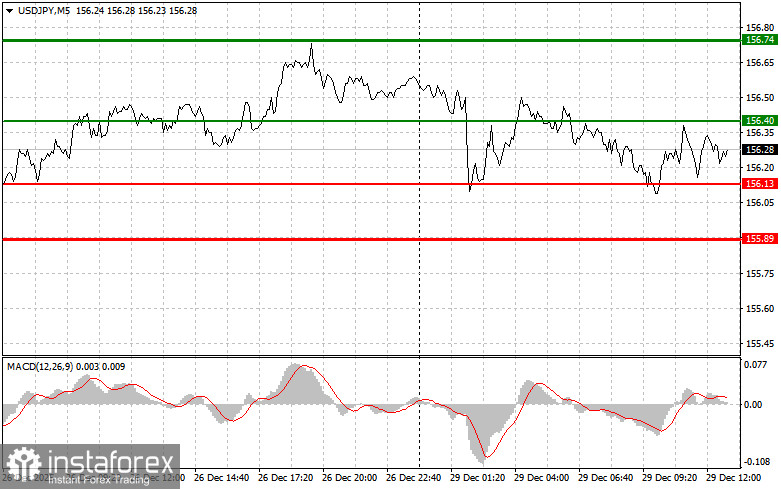
Buy Signal
Scenario No. 1: Today, I plan to buy USD/JPY when the entry point around 156.40 is reached (green line on the chart), targeting growth to the 156.74 level (the thicker green line on the chart). Around 156.74, I plan to exit long positions and open short positions in the opposite direction (expecting a move of 30–35 points from the level). Continued growth of the pair can be expected within the trend.
Important! Before buying, make sure that the MACD indicator is above the zero line and is just beginning to rise from it.
Scenario No. 2: I also plan to buy USD/JPY today in the case of two consecutive tests of the 156.13 price level when the MACD indicator is in the oversold area. This will limit the downward potential of the pair and lead to a reversal of the market upward. Growth toward the opposite levels of 156.40 and 156.74 can be expected.
Sell Signal
Scenario No. 1: I plan to sell USD/JPY today after a break below the 156.13 level (red line on the chart), which would lead to a rapid decline in the pair. The key target for sellers will be the 155.89 level, where I plan to exit short positions and immediately open long positions in the opposite direction (expecting a move of 20–25 points in the opposite direction from the level). Pressure on the pair may return today in the case of weak U.S. data.
Important! Before selling, make sure that the MACD indicator is below the zero line and is just beginning to fall from it.
Scenario No. 2: I also plan to sell USD/JPY today in the case of two consecutive tests of the 156.40 price level when the MACD indicator is in the overbought area. This will limit the upward potential of the pair and lead to a reversal of the market downward. A decline toward the opposite levels of 156.13 and 155.89 can be expected.
What's on the Chart:
Important:
Beginner Forex traders should make market entry decisions very cautiously. Before the release of major fundamental reports, it is best to stay out of the market to avoid sharp price fluctuations. If you decide to trade during news releases, always place stop-loss orders to minimize losses. Without stop-loss orders, you can lose your entire deposit very quickly, especially if you do not use money management and trade large volumes.
And remember that successful trading requires a clear trading plan, such as the one presented above. Spontaneous trading decisions based on the current market situation are an inherently losing strategy for an intraday trader.


