See also

 14.11.2025 11:52 AM
Trend Analysis (Fig. 1).
On Friday, from the level of 1.3187 (yesterday's daily candle close), the market may begin moving downward toward 1.3110 – the 161.8% target level (red dashed line). When testing this level, an upward retracement toward 1.3148 – a historical resistance level (light-blue dashed line) is possible.
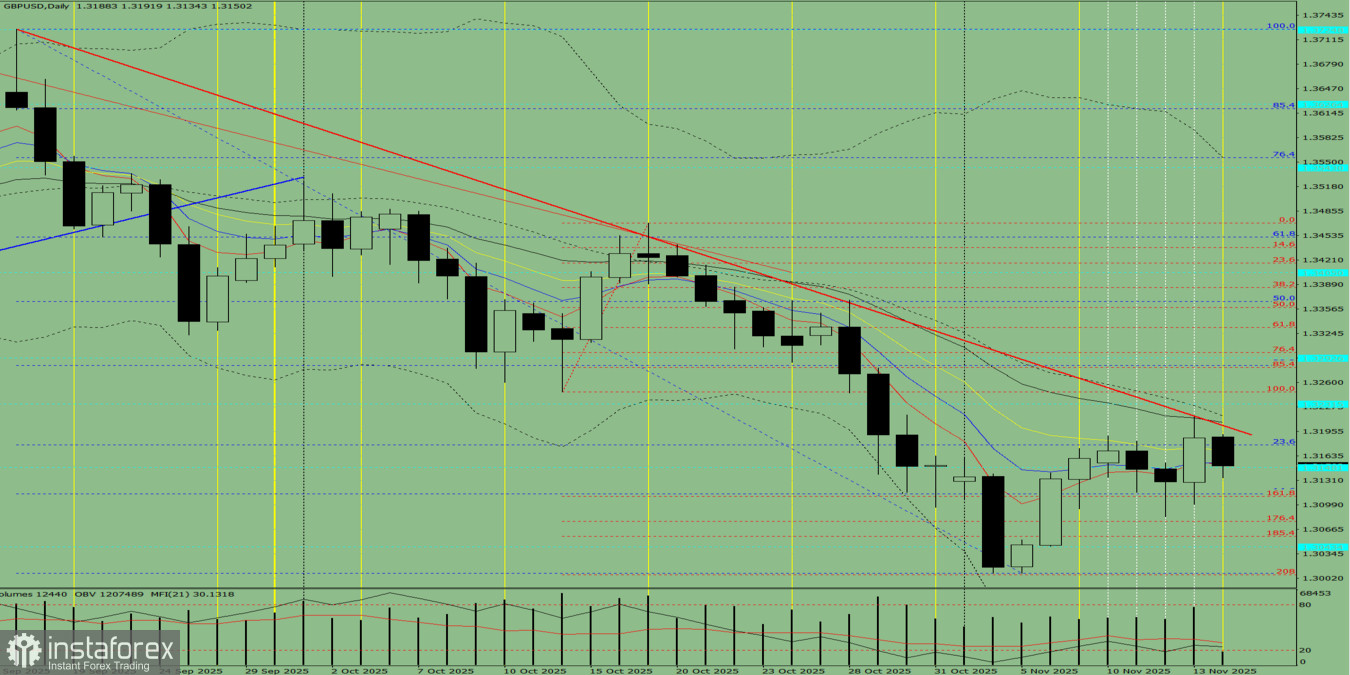
Fig. 1 (daily chart).
Composite Analysis:
Overall conclusion: downward trend.
Alternative scenario: From the level of 1.3187 (yesterday's daily candle close), the price may begin moving downward toward 1.3077 – the 176.4% target level (red dashed line). When testing this level, an upward retracement toward 1.3110 – the 161.8% target level (red dashed line) is possible.
You have already liked this post today
*The market analysis posted here is meant to increase your awareness, but not to give instructions to make a trade.


