See also

 13.10.2025 09:52 AM
Trend Analysis (Fig. 1)
On Monday, from the level of 1.1621 (the closing price of Friday's daily candle), the market may begin moving downward toward 1.1593 — the 61.8% retracement level (blue dashed line). Upon reaching this level, the price may move upward toward 1.1608 — the historical resistance level (light blue dashed line).
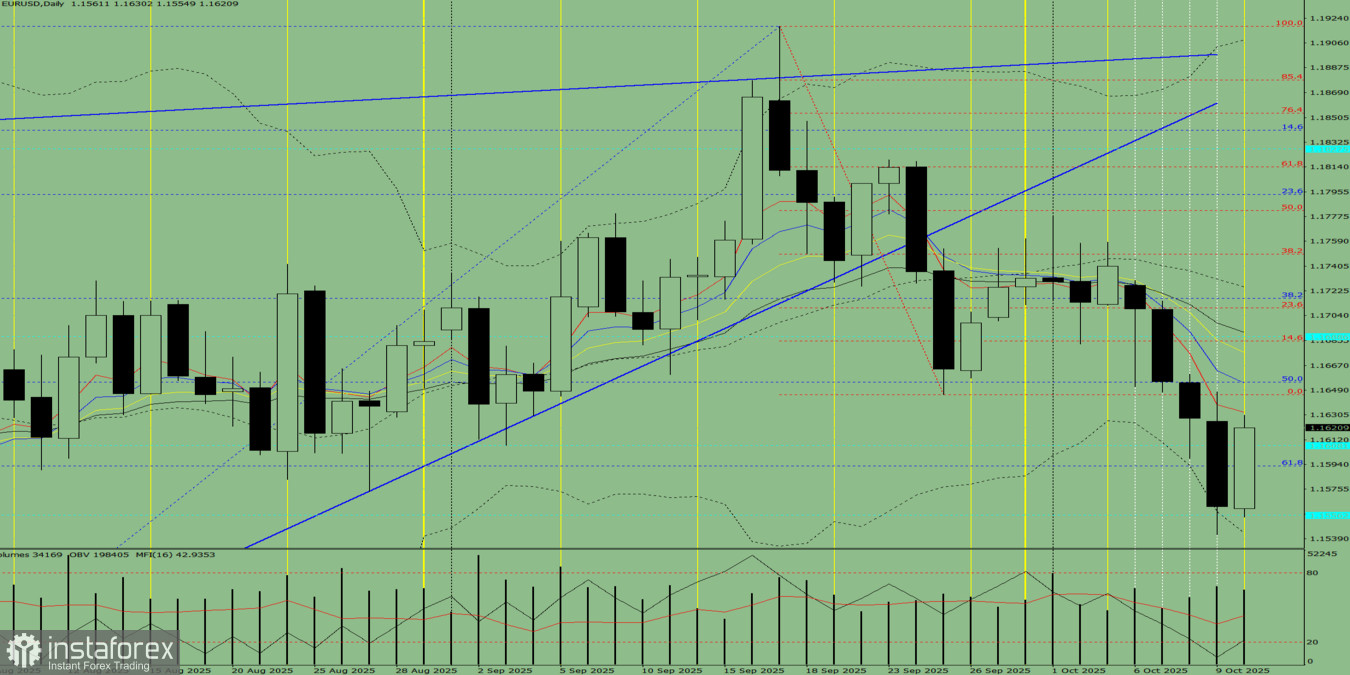
Figure 1: Daily Chart
Comprehensive Analysis
Overall conclusion: downward trend.
Alternative Scenario
From the level of 1.1621 (closing price of Friday's daily candle), the price may begin moving downward toward 1.1556 — the historical support level (light blue dashed line). Upon reaching this level, the price may start to rise toward 1.1593 — the 61.8% retracement level (blue dashed line).
You have already liked this post today
*The market analysis posted here is meant to increase your awareness, but not to give instructions to make a trade.


