See also

 21.04.2025 07:24 PM
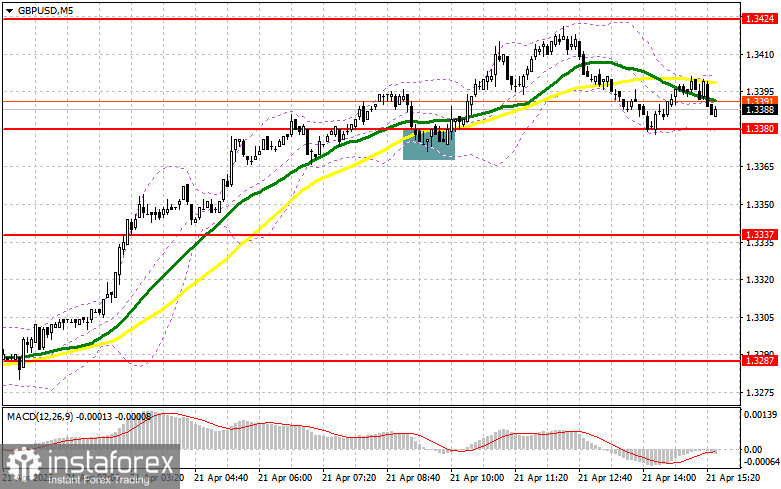
In my morning forecast, I highlighted the 1.3380 level and planned to make entry decisions based on it. Let's look at the 5-minute chart and analyze what happened. A decline followed by a false breakout around 1.3380 provided an entry point into long positions in continuation of the bullish market, leading to a rise in the pair to the 1.3424 area. The technical picture was not revised for the second half of the day.
To open long positions on GBP/USD:
The absence of UK news allowed the pound to continue rising, which was quite expected in such a bullish market. In the second half of the day, comments from FOMC member Austan D. Goolsbee are unlikely to cause a spike in volatility, so I wouldn't count on a sharp drop in the pair. Data on the Leading Indicators Index is also unlikely to disrupt the bullish trend, so any drop in the pound can be considered a potential buying opportunity.
In the event of a decline, I will act after a false breakout forms around the well-proven 1.3380 support area. This will provide a good entry point into long positions targeting resistance at 1.3424. A breakout with a retest from top to bottom of this range will offer a new long entry point with the goal of reaching 1.3468, which would further strengthen the bullish market. The furthest target will be the 1.3510 area, where I will take profit.
If GBP/USD falls and bulls show no activity at 1.3380 in the second half of the day, pressure on the pair will increase. In that case, only a false breakout around 1.3337 will be a suitable condition to open long positions. I plan to buy GBP/USD immediately on a rebound from 1.3287 with an intraday correction target of 30–35 points.
To open short positions on GBP/USD:
Sellers made their presence known around 1.3424—and that was it. But frankly, the halt in growth near 1.3424 is more likely due to decreased demand for the pound rather than any notable selling pressure. If GBP/USD rises again during the US session, a false breakout around 1.3424 will serve as a short entry point with a target at 1.3380 support.
A breakout and retest from below of this range will trigger stop-loss orders and open the way toward 1.3337, where the moving averages—currently supporting the bulls—are located. The furthest target will be 1.3287, where I'll take profit.
If demand for the pound persists in the second half of the day and bears don't show up around 1.3424—which is more likely—then it's better to postpone short positions until a test of the 1.3468 resistance. I'll open shorts there only after a failed consolidation. If there's no downward movement even there, I'll look for short-term rebound shorts around 1.3510, targeting a 30–35 point correction.
Commitment of Traders (COT) Report – April 8:
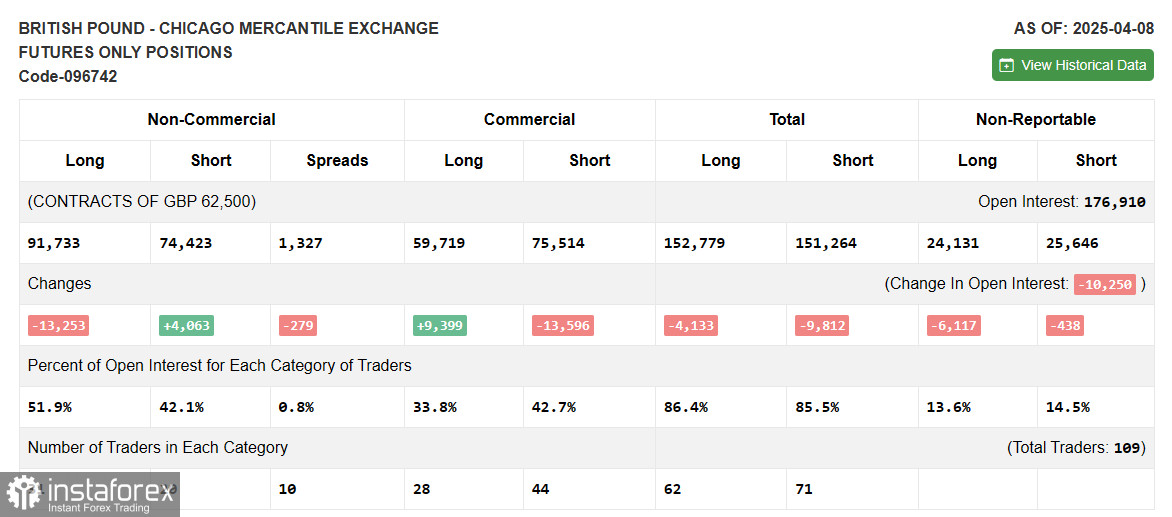
There was a slight increase in short positions and a decrease in long positions. It's important to note that this report reflects Trump's decision to freeze trade tariffs for 90 days, but does not account for the latest strong UK economic growth data. Still, demand for the pound persists, as evidenced by the advantage of buyers over sellers.
The latest COT report shows that long non-commercial positions fell by 13,253 to 91,733, while short non-commercial positions rose by 4,063 to 74,423. As a result, the gap between long and short positions decreased by 279.
Indicator Signals:
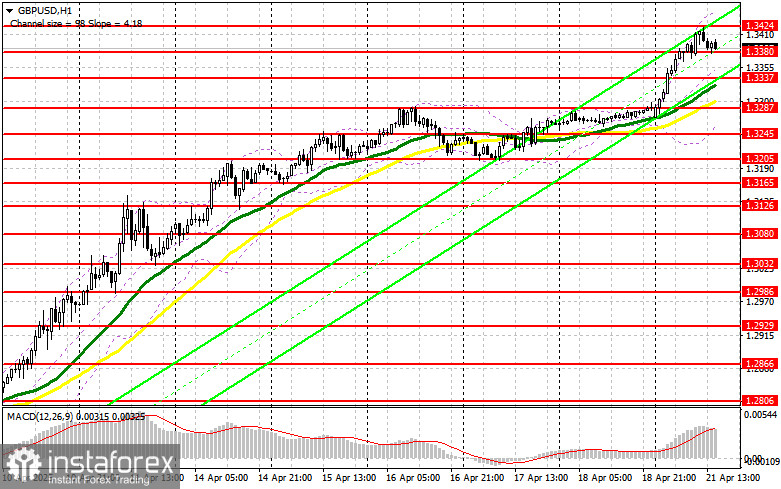
Moving Averages: Trading is taking place above the 30- and 50-day moving averages, indicating continued growth for the pair.
Note: The periods and prices of the moving averages are based on the author's H1 chart and may differ from the standard daily moving averages on the D1 chart.
Bollinger Bands: In case of a decline, the lower boundary of the indicator near 1.3245 will act as support.
Indicator Descriptions: • Moving Average – Determines the current trend by smoothing volatility and noise. Period – 50 (yellow); • Moving Average – Period – 30 (green); • MACD (Moving Average Convergence/Divergence) – Fast EMA: 12; Slow EMA: 26; Signal line (SMA): 9; • Bollinger Bands – Period: 20; • Non-commercial traders – Speculators such as individual traders, hedge funds, and large institutions using the futures market for speculative purposes and meeting specific criteria; • Long non-commercial positions – Total open long positions held by non-commercial traders; • Short non-commercial positions – Total open short positions held by non-commercial traders; • Net non-commercial position – The difference between short and long positions held by non-commercial traders.


