See also

 29.04.2024 12:21 PM
GBP/USD
Analysis:
The British pound in its main pair has been primarily moving sideways since July last year. The incomplete "pennant" formation on the chart suggests the continuation of this trend for at least the next few weeks. The unfinished segment is currently directed downward, with a retracement occurring last week.
Forecast:
For the upcoming week, there's a high probability that the price of the British pound will continue its overall downward trend. In the next few days, a brief upward price movement can be expected. Increased volatility is likely towards the end of the week, possibly coinciding with the release of important economic data.
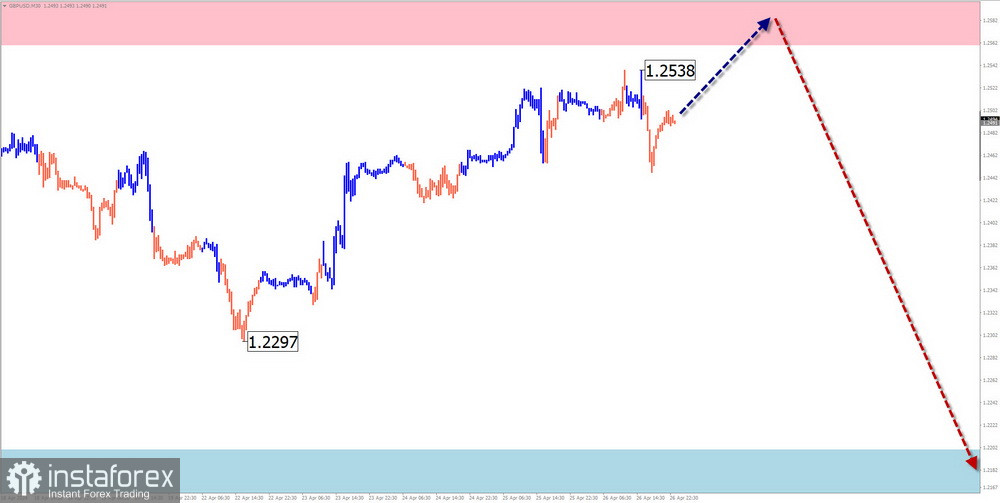
Potential Reversal Zones
Resistance:
Support:
Recommendations:
Buying: Due to limited potential, buying positions may lead to losses.
Selling: After the appearance of confirmed reversal signals around the resistance zone, selling positions may become the main direction for trading.
AUD/USD
Analysis:
Since the beginning of the year, a descending shifting plane has formed on the chart of the Australian dollar's main pair. Its incomplete segment dates back to the end of last December. Quotes from the upper level of the major TF reversal zone formed a counter wave. Its wave level does not exceed the correction boundaries.
Forecast:
For the upcoming week, the continuation of the overall sideways movement of the pair is expected. In the first few days, temporary pressure on the resistance zone is likely. A reversal and a decline towards the calculated support zone will follow this. The highest activity is expected towards the end of the week.
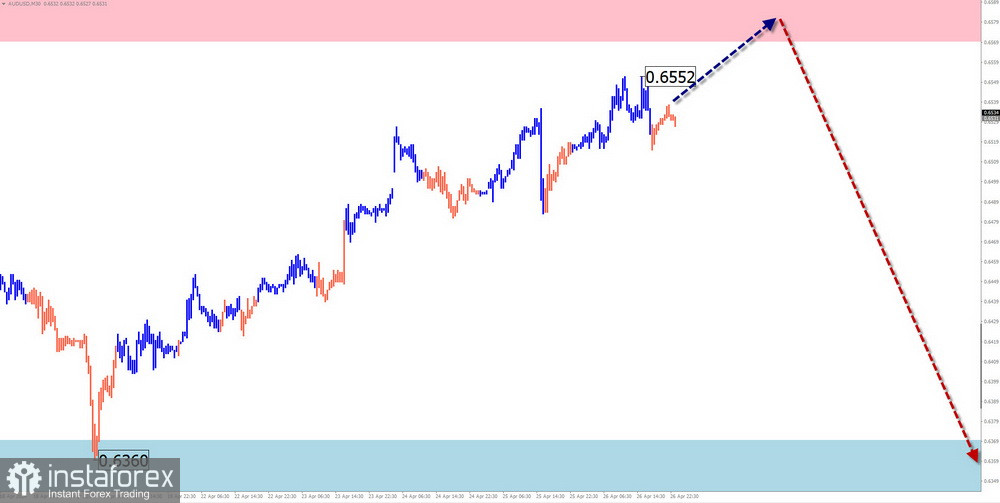
Potential Reversal Zones
Resistance:
Support:
Recommendations:
Selling: After the appearance of confirmed reversal signals around the calculated resistance, they can be used in trading deals.
Buying: Possible with fractional volumes within intraday sessions. The potential is limited by resistance.
USD/CHF
Analysis:
Since December last year, an ascending wave has been setting the main direction of price movements for the Swiss franc. As a result of active price growth in recent months, quotes of the major are approaching the lower boundary of a strong potential reversal zone of the weekly chart. There are no signs of an imminent change in direction on the chart at the time of analysis.
Forecast:
In the first half of the upcoming week, the continuation of the overall upward movement of the pair is expected. After reaching the resistance zone, a reversal and the beginning of a decline in quotes can be expected. The highest volatility is likely closer to the weekend.
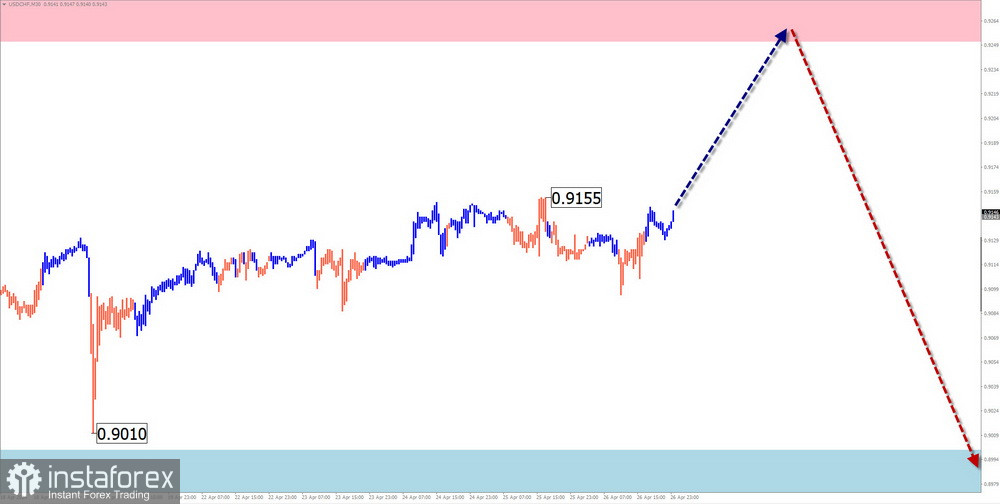
Potential Reversal Zones
Resistance:
Support:
Recommendations:
Selling: There are no conditions for such transactions until confirmed reversal signals appear around the resistance zone.
Buying: Possible with reduced volumes within separate sessions.
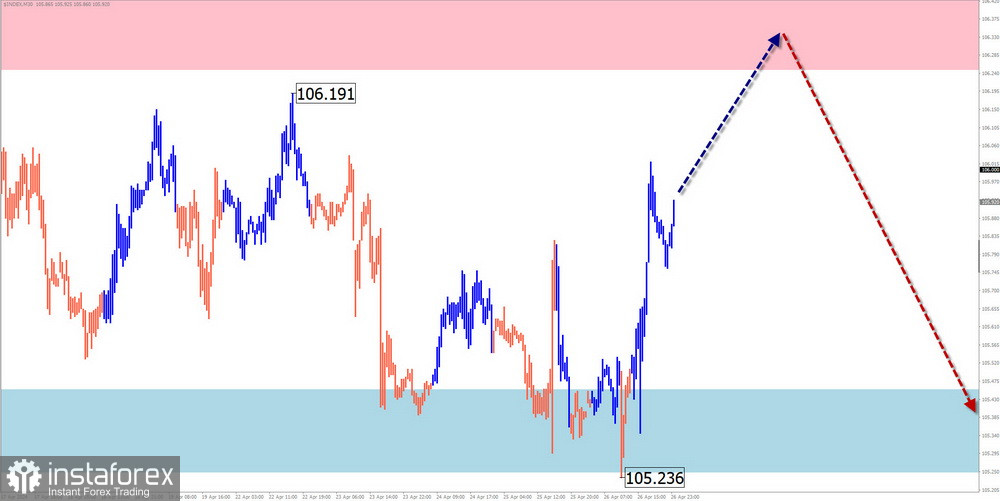
EUR/JPY
Analysis:
The ascending trend continues on the chart of the euro/Japanese yen cross. The unfinished segment dates back to December last year. Since April 12th, the final part (C) of the impulse has been developing. The price is approaching the lower boundary of another potential reversal zone. The calculated resistance passes along its lower boundary.
Forecast:
In the next couple of days, a transition to a sideways flat or a brief pullback towards the support zone can be expected. In the second half of the week, the probability of activation and the resumption of the upward price movement increases. A breakthrough of the calculated resistance boundaries within the upcoming week is unlikely.
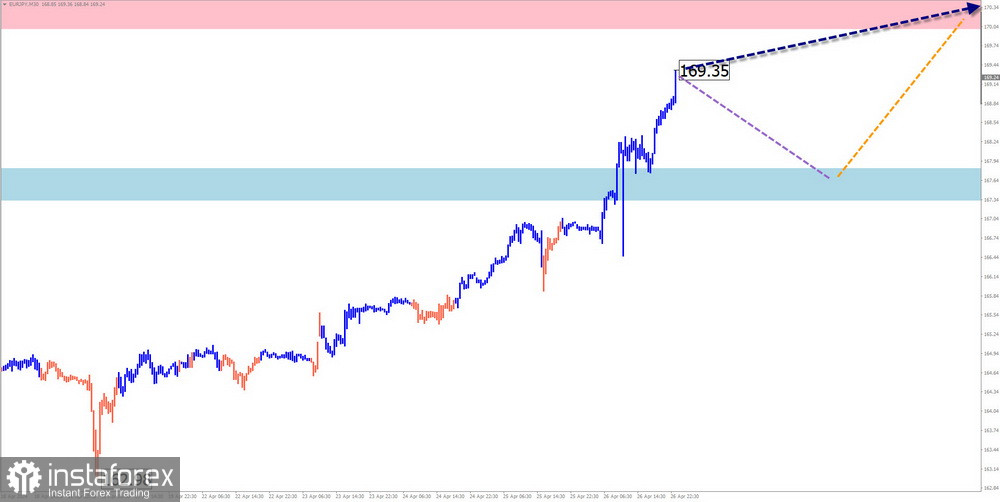
Potential Reversal Zones
Resistance:
Support:
Recommendations:
Selling: High-risk and may lead to losses.
Buying: This can become the main direction for trading deals after the appearance of confirmed reversal signals on your trading systems.
AUD/JPY
Analysis:
For the past few years, the direction of the Australian dollar/Japanese yen cross has been set by an ascending trend. Its unfinished segment dates back to December last year. Quotes have reached the boundaries of a wide potential reversal zone on the weekly chart. The wave structure appears complete at the time of analysis, but there are no signs of an imminent reversal on the chart.
Forecast:
For the upcoming week, the continuation of the overall upward trend in price movement for the cross is expected. In the first few days, a brief flat or a decline in support cannot be excluded. The highest volatility is expected towards the end of the week.
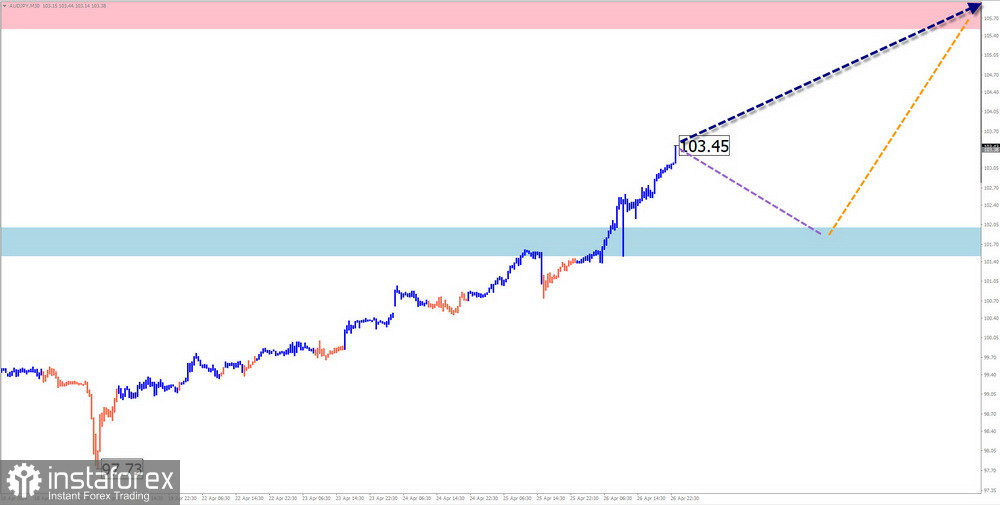
Potential Reversal Zones
Resistance:
Support:
Recommendations:
Selling: There is no potential for such transactions in the coming week.
Buying: This can become the main direction for trading when confirmed signals appear on your trading systems.
US dollar index
Brief Analysis:
An upward trend has been setting the main direction of the US dollar's course since December last year. Quotes are approaching the upper boundary of the potential reversal zone on the weekly chart. Along its lower boundary, quotes formed a corrective segment over the past two weeks. Based on the structure, a shifting plane is forming.
Week Forecast:
For the upcoming week, the continuation of the quotes' movement within the designated corridor is expected. In the first few days, a rise in the index's value can be expected up to the calculated resistance boundaries. After reaching the zone, there is a high probability of transitioning to a sideways drift, creating conditions for a reversal. The index's decline will likely start in the second half of the week.
Potential Reversal Zones
Resistance:
Support:
Recommendations:
There are no conditions for buying national currencies in the main pairs in the coming days. However, expecting a prolonged strengthening of the US dollar is also not advisable. The trend in the coming weeks may change significantly.
Explanation: In simplified wave analysis (SWA), all waves consist of 3 parts (A-B-C). The latest unfinished wave is analyzed at each TF. Dotted lines indicate expected movements.
Attention: The wave algorithm does not consider the duration of instrument movements over time!
You have already liked this post today
*The market analysis posted here is meant to increase your awareness, but not to give instructions to make a trade.


