See also

 02.05.2024 04:12 PM
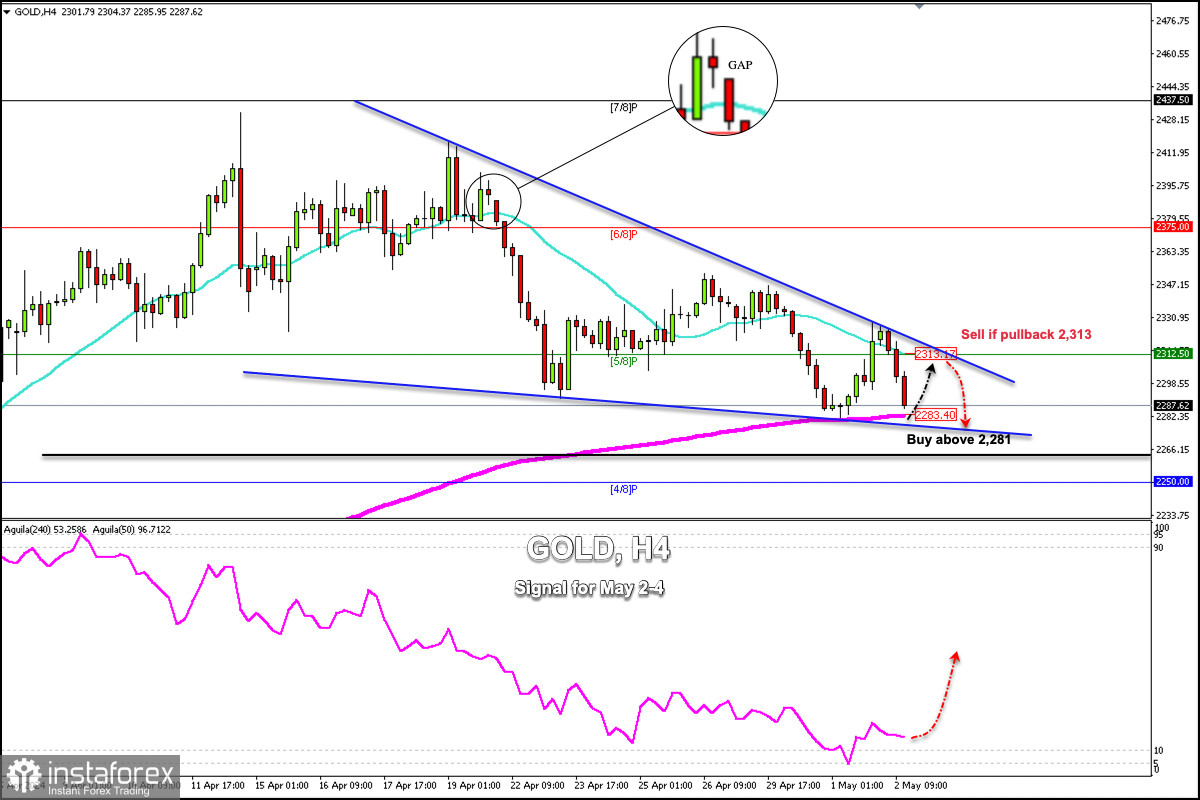
Gold is trading around 2,287.62, above the 200 EMA, and within a symmetrical triangle pattern forming since April 16. Yesterday, gold reached the 2,230 area, it tried to break this downtrend channel but failed. Since then, we observed a strong technical correction. Today the metal is expected to find good support around 2,287 in the next few hours or above 2,280.
The symmetrical triangle pattern could offer a good opportunity for a bullish move in either direction. A break above 2,330 could accelerate the bullish movement and gold could reach the 2,392 area, where it left a gap on April 18.
With a decline and consolidation below 2,283, we could expect gold to resume its bearish cycle. So, the price could reach 2,250 and the psychological level of 2,200.
Technically, since May 1, gold has reached the extremely oversold zone. Therefore, the metal is expected to have a technical rebound in the coming days. So, we will look for opportunities to buy above 2,283 and in case the price is rejected around 2,313. This could be seen as a signal to sell.
If we operate within the symmetrical triangle pattern, we could look for opportunities to buy at support and sell at resistance. Outside of this pattern, we should pay attention to the trend that the instrument follows.
You have already liked this post today
*The market analysis posted here is meant to increase your awareness, but not to give instructions to make a trade.


