empty
22.09.2023 09:06 PM
September 22, 2023 : Analyzing Recent Trends and Trading Opportunities in EUR/USD: A Technical Analysis Perspective.

This image is no longer relevant

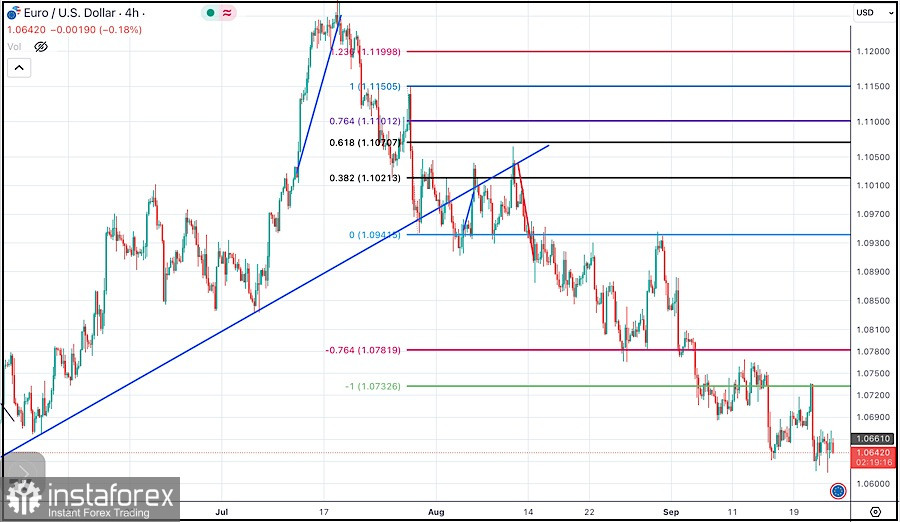
By the end of June, the buyers struggled to break above 1.0930, which was a crucial hurdle, and only managed to reach 1.1200 briefly before the bears took over.

Shortly after, the EUR/USD pair has been trading in a narrow range between 1.0600 and 1.1000, waiting for a clear direction from the market sentiment and the economic data.

The recent breakout above 1.1000 signalled upside movement towards 1.1200, where a downside pullback was initiated towards 1.1000 which failed to provide enough support for the pair.

The recent upside pullback towards 1.1050 (backside of the broken uptrend) was considered for a valid SELLING opportunity.

Moreover, the current downside movement of the price was expected towards 1.0780 which failed to show significant bullish recovery.

Further downside movement extended towards 1.0730 where the next support level was located.

On the other hand, any upside movement towards 1.0800-1.0830 should be considered for another SELL Entry.

Recommended Stories

XAU/USD. Analysis and Forecast

Gold prices are declining for the second consecutive day from record highs after volatility triggered by the Fed's actions. For the second day in a row, gold prices are retreating

Irina Yanina 20:12 2025-09-18 UTC+2

Forecast for EUR/USD on September 18, 2025

On Wednesday, the EUR/USD pair rebounded from the 127.2% corrective level at 1.1896, reversed in favor of the U.S. dollar, and fell into the support zone of 1.1789–1.1802

Samir Klishi 12:21 2025-09-18 UTC+2

Forecast for GBP/USD on September 18, 2025

On the hourly chart, the GBP/USD pair on Wednesday rose to the 127.2% Fibonacci level at 1.3708, rebounded from it, and reversed in favor of the U.S. dollar, falling into

Samir Klishi 12:17 2025-09-18 UTC+2

GBP/USD. Indicator analysis on September 18, 2025

On Wednesday, the pair moved upward to resistance at 1.3725 (blue dotted line), then turned downward, closing the daily candle at 1.3622. Today, it may continue moving lower. On Thursday

Stefan Doll 11:59 2025-09-18 UTC+2

EUR/USD. Indicator analysis on September 18, 2025

On Wednesday, the pair moved upward to the 208% level at 1.1908 (red dotted line), then turned downward, closing the daily candle at 1.1812. Today, it may continue moving lower

Stefan Doll 11:38 2025-09-18 UTC+2

Forex forecast 18/09/2025: EUR/USD, GBP/USD, USD/JPY, USDX and Bitcoin

Useful links: My other articles are available in this section InstaForex course for beginners Popular Analytics Open trading account Important: The begginers in forex trading need to be very careful

Sebastian Seliga 10:14 2025-09-18 UTC+2

There is potential for XPD/USD to weaken today with the appearance of a Hidden Bearish Divergence. Thursday, September 18, 2025.

[XPD/USD] – [Thursday, September 18, 2025] The appearance of a Hidden Bearish Divergence, coupled with the two EMAs crossing with a Death Cross, indicates that Palladium has the potential

Arief Makmur 07:28 2025-09-18 UTC+2

The Nasdaq 100 Index has the potential to strengthen today, reaching its nearest resistance level. Thursday, September 18, 2025.

[Nasdaq 100 Index] – [Thursday, September 18, 2025] The Nasdaq 100 Index has the potential to strengthen today, as confirmed by its two EMAs intersecting in a Golden Cross

Arief Makmur 07:28 2025-09-18 UTC+2

Trading Signals for EUR/USD for September 18-23, 2025: buy above $1.1790 (+1/8 Murray - 21 SMA)

Early in the European session, the euro is trading around 1.1813 following a technical correction after the price reached a new high around 1.1917. The euro has been trading within

Dimitrios Zappas 06:50 2025-09-18 UTC+2

Trading Signals for GOLD (XAU/USD) for September 18-23, 2025: sell bellow $3,671 (7/8 Murray - 21 SMA)

Conversely, if gold consolidates above $3,671, it could continue its rise until it reaches the 61.8% Fibonacci level around $3,685. The price could even reach the psychological level of $3,700

Dimitrios Zappas 06:48 2025-09-18 UTC+2
Can't speak right now?
Ask your question in the chat.
 

Dear visitor,

Your IP address shows that you are currently located in the USA. If you are a resident of the United States, you are prohibited from using the services of InstaFintech Group including online trading, online transfers, deposit/withdrawal of funds, etc.

If you think you are seeing this message by mistake and your location is not the US, kindly proceed to the website. Otherwise, you must leave the website in order to comply with government restrictions.

Why does your IP address show your location as the USA?

  • - you are using a VPN provided by a hosting company based in the United States;
  • - your IP does not have proper WHOIS records;
  • - an error occurred in the WHOIS geolocation database.

Please confirm whether you are a US resident or not by clicking the relevant button below. If you choose the wrong option, being a US resident, you will not be able to open an account with InstaTrade anyway.

We are sorry for any inconvenience caused by this message.