See also

 18.09.2023 05:42 AM
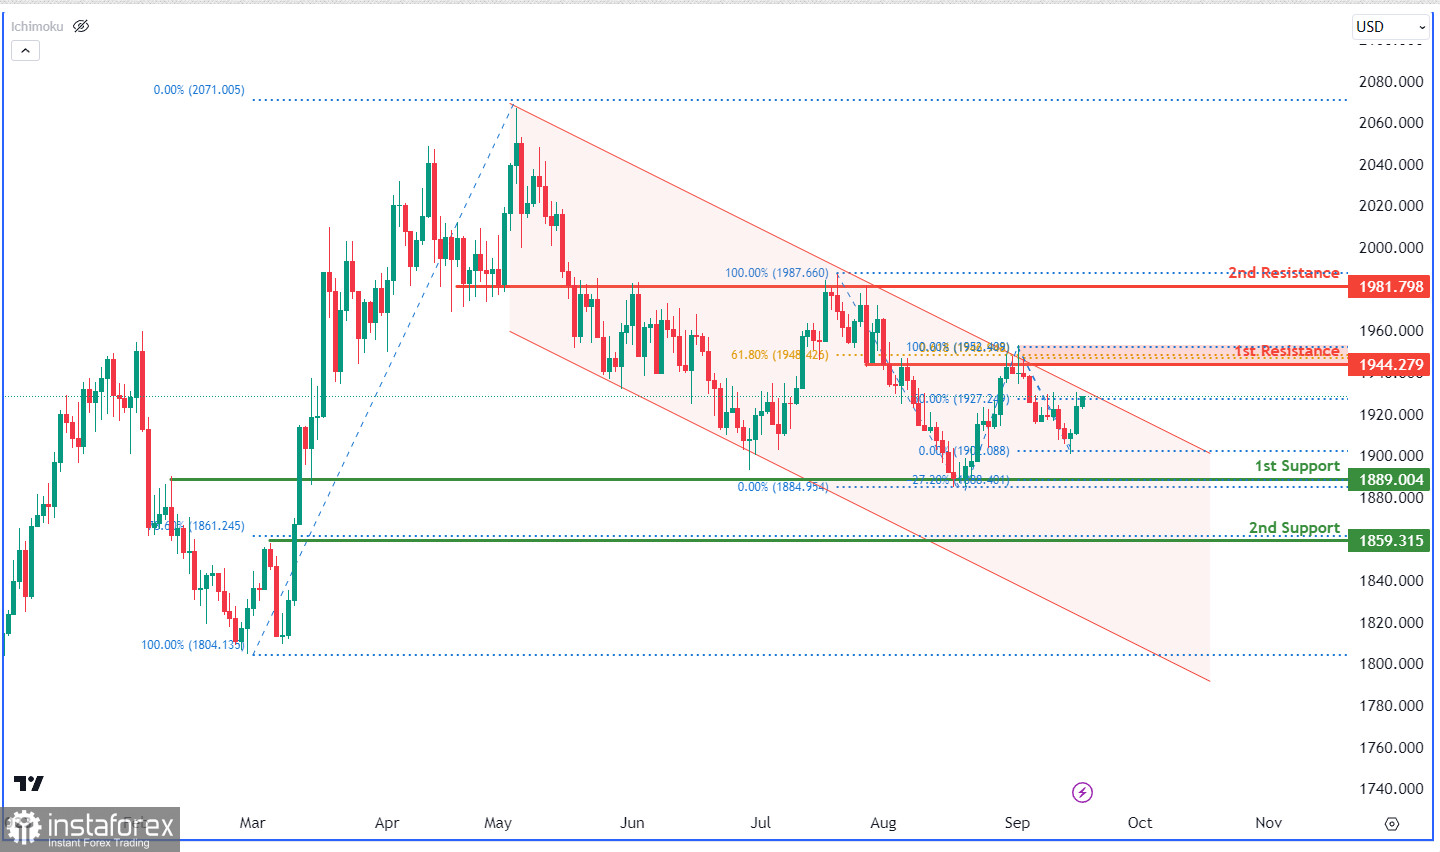
The XAU/USD chart showcases a dominant bearish trend, emphasized by its movement within a bearish descending channel. Price could possibly react bearishly at the 1st resistance of 1944.27 and then move towards the 1st support at 1889.00. This support is significant due to its overlap nature and association with the -27% Fibonacci Expansion. The 2nd support, 1859.31, correlates with the 78.60% Fibonacci Retracement, enhancing its importance. Regarding resistance, the 1st level, 1944.27, is crucial, marked by a Fibonacci confluence of 61.80% Retracement and Projection. The 2nd resistance stands at 1081.79, identified as an overlap resistance, consistent with the chart's overall bearish inclination.
You have already liked this post today
*The market analysis posted here is meant to increase your awareness, but not to give instructions to make a trade.


