
یہ بھی دیکھیں


 11.08.2026 02:54 PM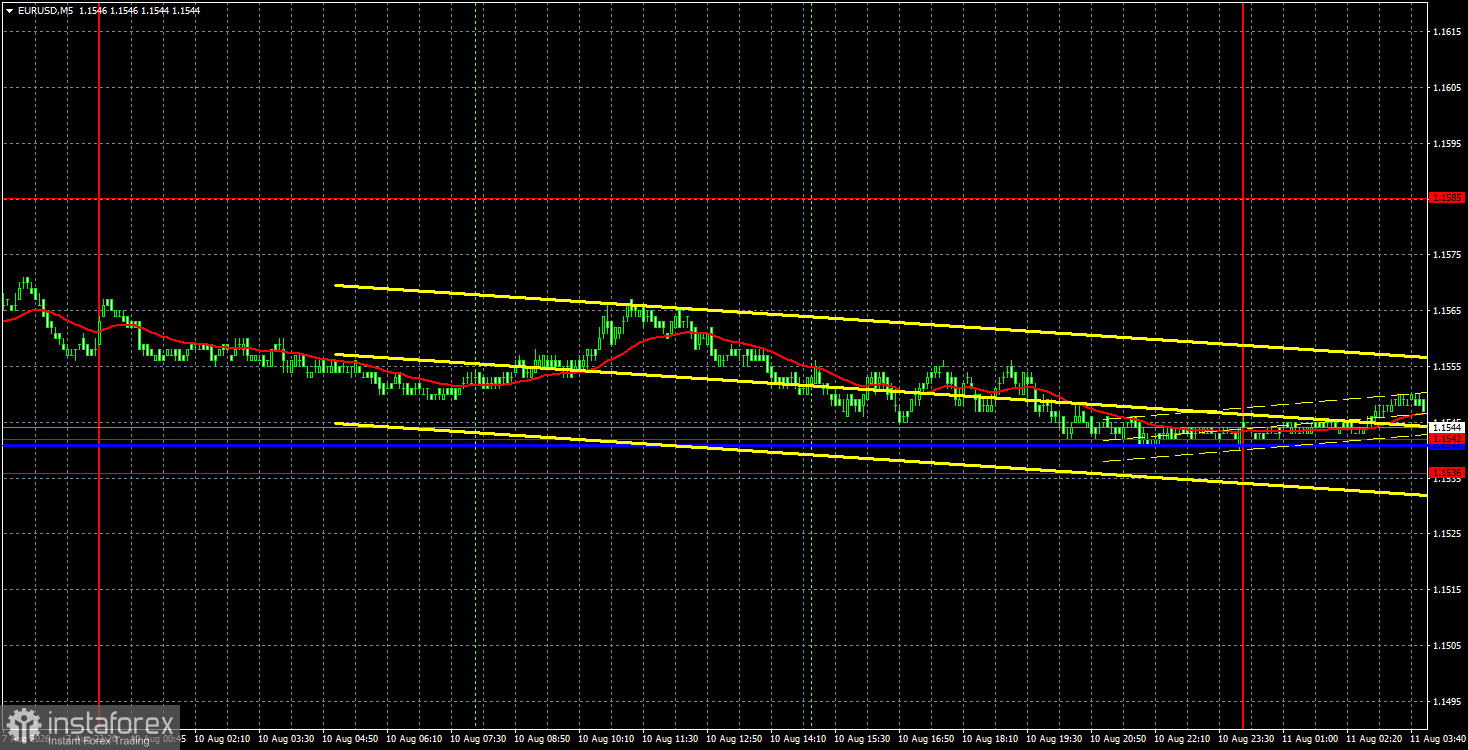
The EUR/USD currency pair showed minimal volatility on Monday, August 10, but moved lower, returning to levels close to where it was before the release of the infamous Nonfarm Payrolls. Thus, as of Tuesday morning, it was as if the Nonfarm Payrolls report had never happened. The dollar lost almost nothing amid the weak labor market report and diminished prospects for further Federal Reserve rate hikes. This greatly concerns us. Recall that in 2026, the US dollar is appreciating steadily. These periods of growth do not allow it to break the long-term trend, but they also do not allow the trend itself to continue. The pair remains within a sideways channel on the weekly timeframe, but on shorter timeframes we regularly see the US currency strengthening, despite there being no clear reason for it. The market continues to ignore many factors in favor of the euro. Friday was a bright example of this. Given the current state of the labor market, the Fed is unlikely to pursue monetary tightening. Thus, the market has once again miscalculated, believing that Kevin Warsh intends to bring inflation to 2% at all costs. Most likely, he will combat it in the Powell style: acknowledging its high level but not losing sight of the labor market and other important indicators (for example, the state of the economy).
From a technical perspective, the pair has exited the sideways channel of 1.1362–1.1461 after a month of "walking through torments" and is in an upward trend. The euro is generally rising, but we believe this is insufficient. The dollar currently has virtually no trump cards. It is saved only by the fact that it is the world's most popular currency, and therefore it cannot fall continuously.
On the 5-minute timeframe, no trading signals were formed on Monday. Only by the end of the day did the pair slide into the 1.1536–1.1542 area, so a signal may form today.
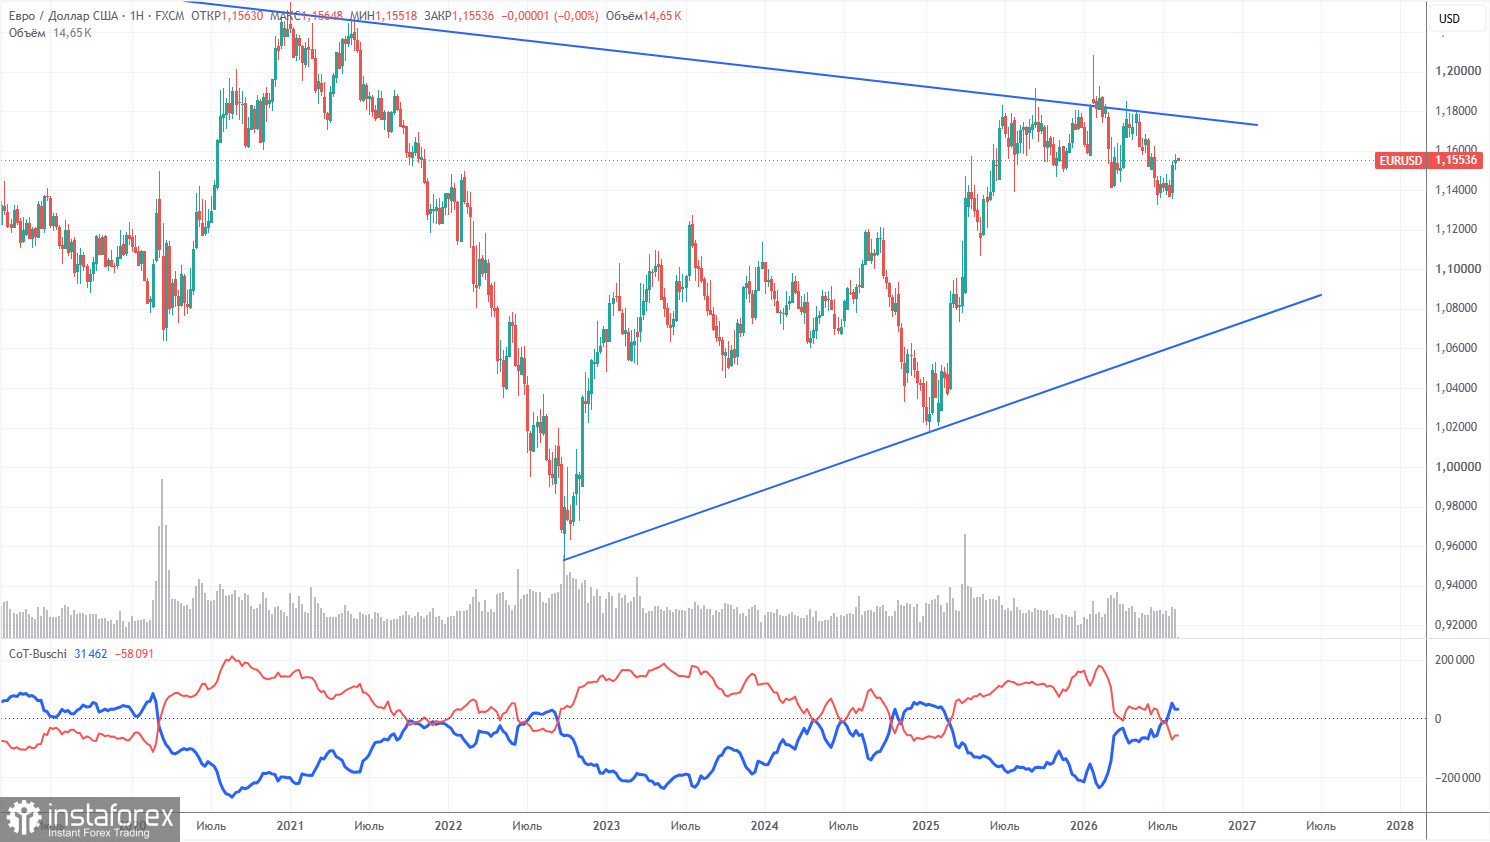
The latest COT report is dated August 4. The illustration on the weekly timeframe clearly shows that the net position of non-commercial traders has become "bearish" and significantly decreased in 2026 due to geopolitical events. Traders have been shedding European currency in favor of the US dollar in recent months. Donald Trump's policies have not changed, but the dollar has served as a "reserve currency" for a while.
We still do not see any fundamental factors supporting the strengthening of the euro, while there remain sufficient factors supporting the decline of the US dollar. The war in the Middle East made the dollar temporarily super-attractive, but when this factor expires, everything will return to normal. In the long term, the euro could fall as low as $1.08 (along the trend line), but the upward trend will remain relevant. And during the recent months of dollar growth, the pair has not come close to that line.
The arrangement of the red and blue indicator lines indicates parity between bulls and bears. During the last reporting week, the number of longs in the "Non-commercial" group decreased by 3,100, while the number of shorts increased by 17,500. Accordingly, the net position for the week grew by 14,400 contracts.
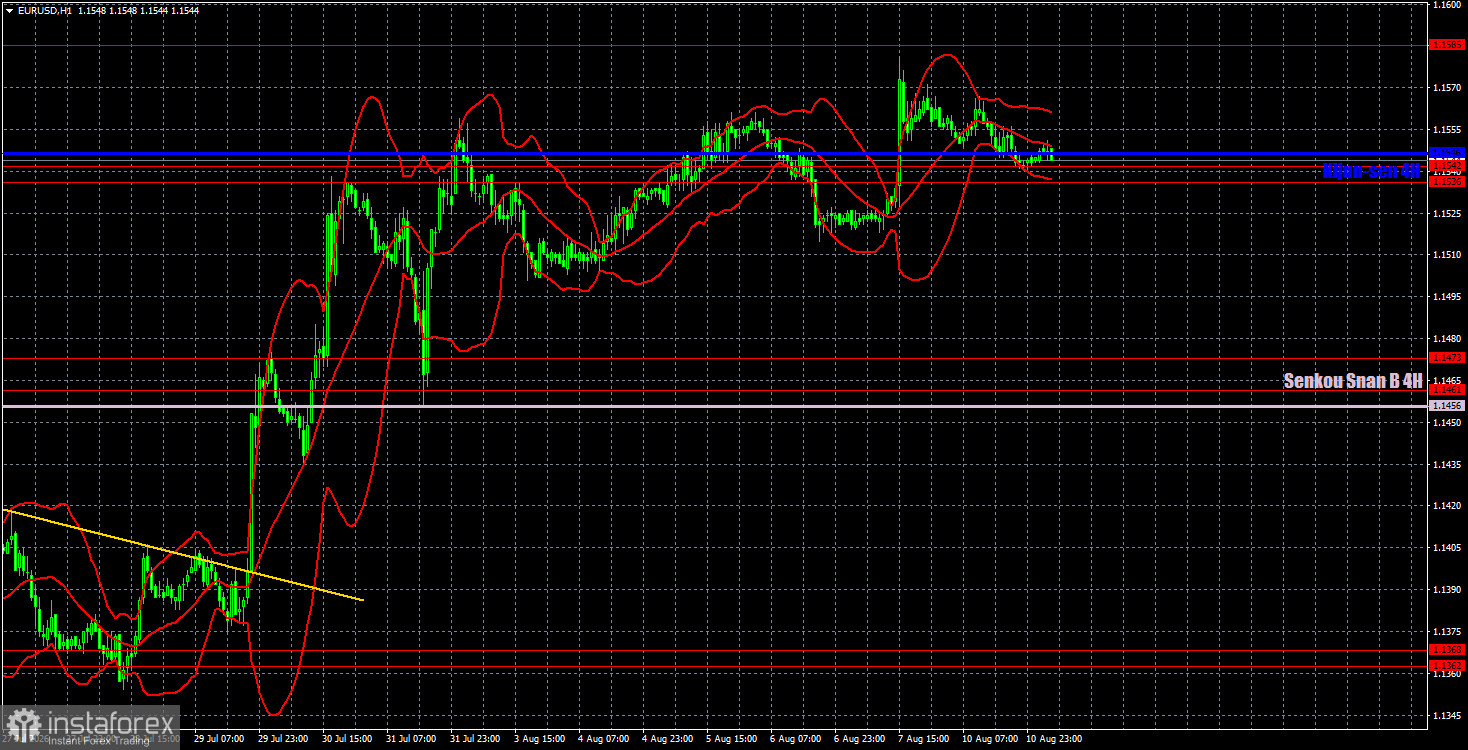
On the hourly timeframe, the pair continues its upward trend after a month-long pause. The situation in the Middle East remains tense and is not improving, but this is no longer sufficient for a new, significant rise of the dollar. In recent months, the market has ignored all the positive factors for the euro and focused solely on Fed monetary policy, which it had overestimated. Now the veil is lifting from traders' eyes, so the European currency has every chance for medium-term growth.
For August 11, we highlight the following levels for trading: 1.1234, 1.1274, 1.1362–1.1368, 1.1461–1.1473, 1.1536–1.1542, 1.1585, 1.1657–1.1666, 1.1750–1.1760, 1.1786, 1.1830–1.1837, as well as the Senkou Span B line (1.1456) and Kijun-sen (1.1546). The Ichimoku indicator lines may shift during the day, which should be taken into account when determining trading signals. Don't forget to set a Stop Loss order to break even if the price moves 15 pips in the correct direction. This will protect against potential losses if the signal proves false.
On Tuesday, no important publications or events are scheduled in the EU or the US again. Thus, volatility may be low today. The most interesting and nearest report will come out tomorrow—US inflation data.
Today, traders may consider short positions targeting 1.1461–1.1473 if the pair consolidates below the 1.1536–1.1542 area. A rebound from the 1.1536–1.1542 area will allow for opening long positions targeting 1.1585 and 1.1657–1.1666.
سپورٹ اور مزاحمتی قیمت کی سطحیں (موٹی سرخ لکیریں) بتاتی ہیں کہ حرکت کہاں ختم ہو سکتی ہے۔ وہ تجارتی سگنل کے ذرائع نہیں ہیں۔
Kijun-sen اور Senkou Span B لائنیں Ichimoku انڈیکیٹر لائنیں ہیں جنہیں 4 گھنٹے کے ٹائم فریم سے فی گھنٹہ ٹائم فریم میں منتقل کیا جاتا ہے۔ وہ مضبوط لکیریں ہیں۔
ایکسٹریم لیولز (پتلی سرخ لکیریں) اس بات کی نشاندہی کرتی ہیں کہ قیمت پہلے کہاں باؤنس ہوئی ہے۔ وہ تجارتی سگنل کے ذرائع ہیں۔
پیلی لکیریں ٹرینڈ لائنز، ٹرینڈ چینلز اور کسی دوسرے تکنیکی نمونوں کی نمائندگی کرتی ہیں۔
COT چارٹ پر انڈیکیٹر 1 تاجروں کے ہر زمرے کی خالص پوزیشن کا سائز دکھاتا ہے۔


