یہ بھی دیکھیں

 21.05.2026 03:30 AM
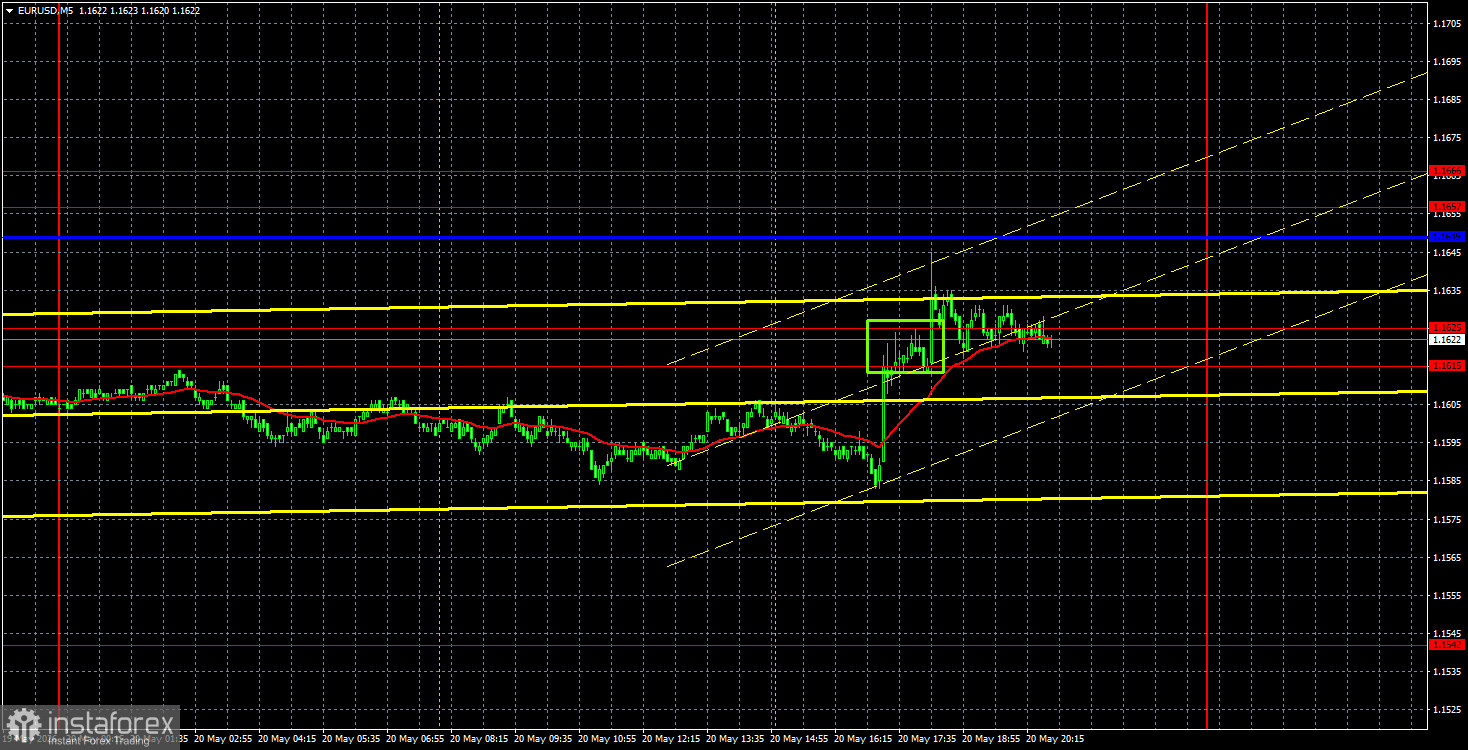
The EUR/USD currency pair traded quietly for most of the day on Wednesday, but soared near the end of the day. There is no doubt about what triggered this latest "flight" in the currency market. Even without checking the news feed, one can confidently assume that yet another report about successful negotiations or the imminent conclusion of the conflict came in. Those traders who bet on this scenario won. In the evening, Donald Trump announced successful talks with Iran that would allow the U.S. to achieve many of its list of demands. Trump also noted that Iran is "behaving very well" and "things are going very well." Naturally, the market could not overlook this announcement, especially since no other significant news was released during the day. And now, the U.S. dollar is falling again. But for how long? News of the talks failing could surface today (as it has several times before), sending the EUR/USD pair plunging once more.
From a technical perspective, the downward trend persists on the hourly timeframe. This will continue until the price breaks through the Senkou Span B line. Given the constant shifts in geopolitical dynamics, it would not surprise us if yesterday's surge in the euro is short-lived. Geopolitics continues to toss all financial markets back and forth.
On the 5-minute timeframe on Wednesday, one buy signal was generated. During the American trading session, the price broke through the 1.1615-1.1625 area, but we would not recommend buying euros until Trump's statements are confirmed.
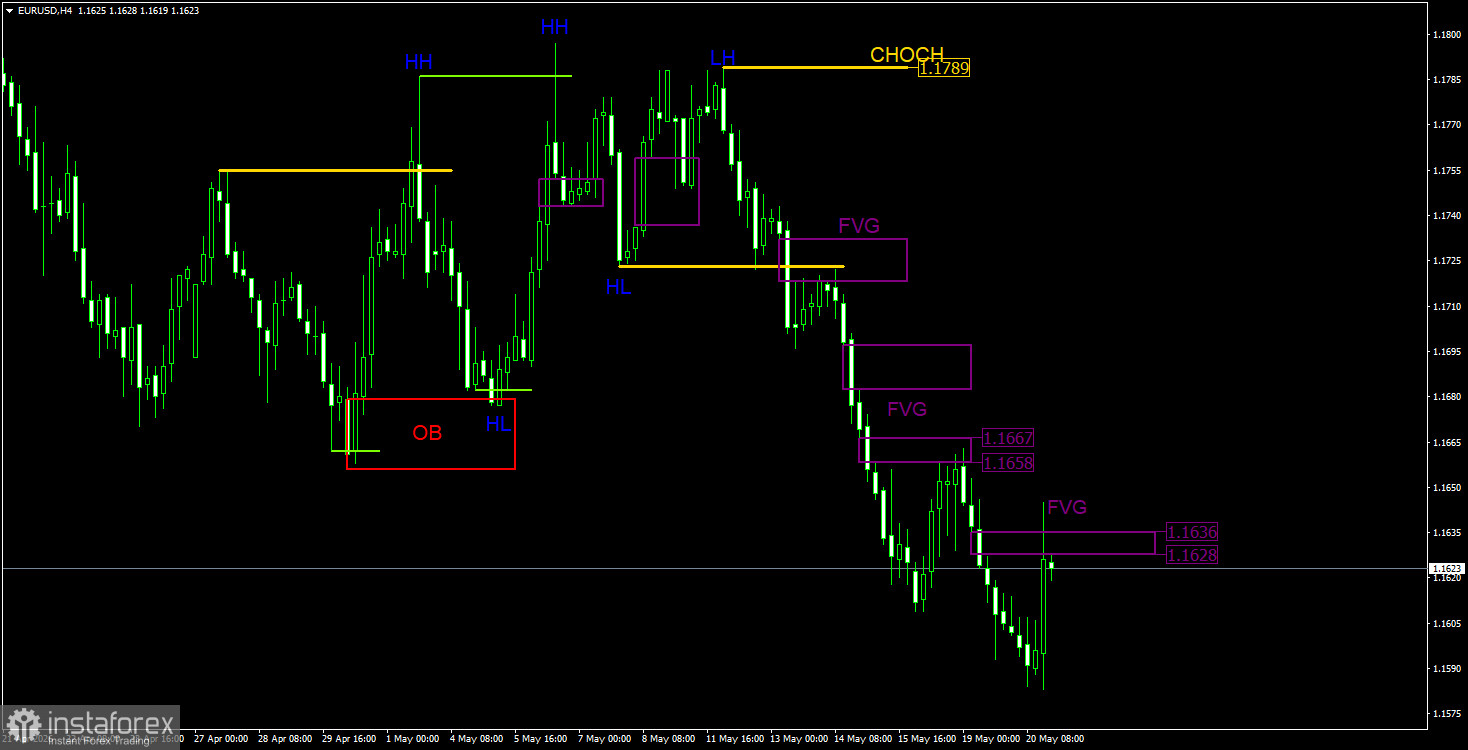
On the 4-hour timeframe, according to the ICT trading system, the price tested the area of 1.1628-1.1636 on Tuesday, which marks the last "bearish" FVG. Since the pair's rise was prompted by new positive geopolitical news, we would not take the euro's surge too seriously. There have been numerous occasions when Trump's words have been contradicted by top officials in Tehran, and this could happen again. There are still no clear signs of resolution in the Middle Eastern conflict. Therefore, we would expect a new sell signal to form within the bearish FVG. If this pattern is invalidated, it would indicate a potential shift in trend toward bullish. In that case, bullish patterns for long positions could be considered.
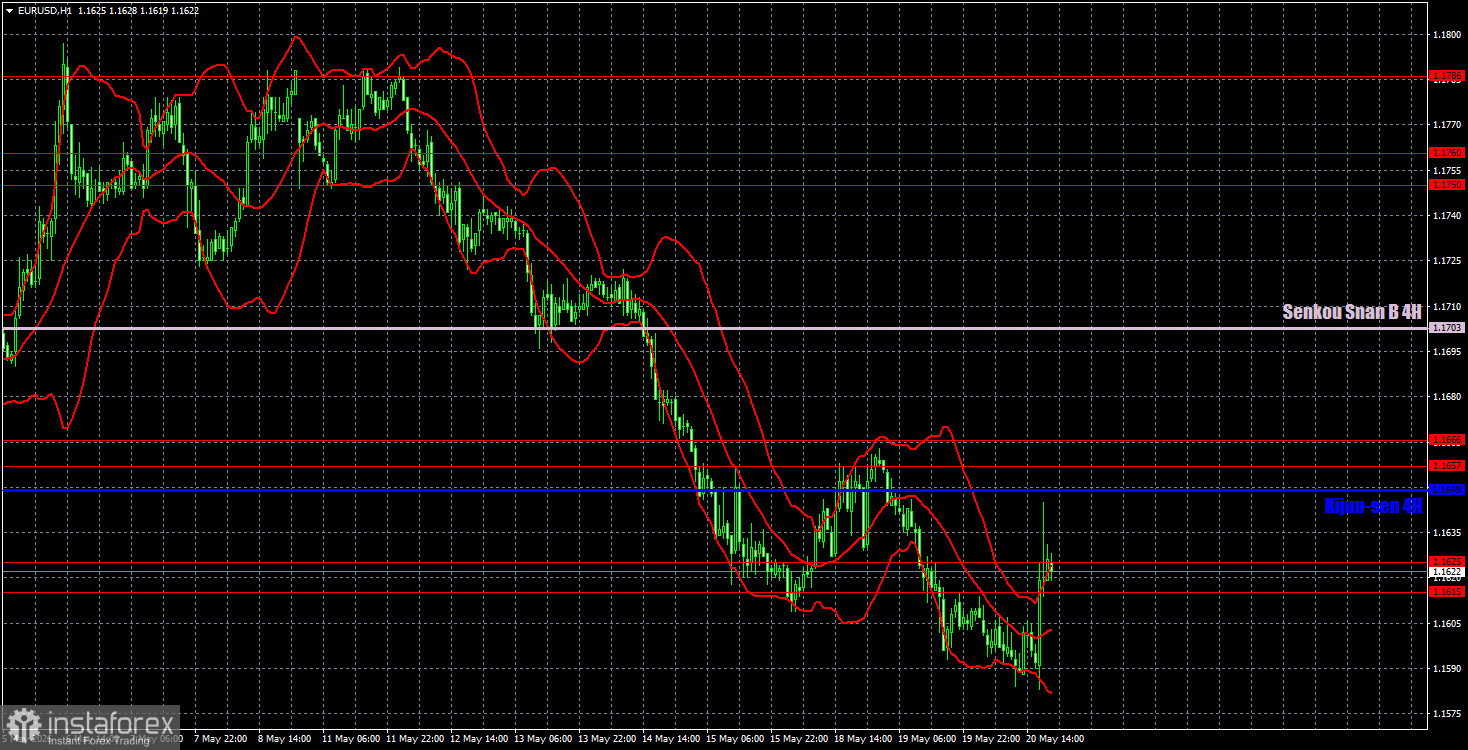
On the hourly timeframe, the EUR/USD pair continues to form a downward trend. The situation in the Middle East remains tense; it is not worsening, but negotiations have once again reached a stalemate, allowing the dollar to show restrained growth. In the near term, the pair's movements will depend on geopolitics. If no new signs of escalation in the Middle East emerge, the dollar will begin to lose ground.
For May 21, we highlight the following levels for trading: 1.1362, 1.1426, 1.1542, 1.1615-1.1625, 1.1657-1.1666, 1.1750-1.1760, 1.1786, 1.1830-1.1837, 1.1907-1.1922, as well as the Senkou Span B line (1.1703) and the Kijun-sen line (1.1649). The lines of the Ichimoku indicator may shift throughout the day, which should be taken into account when determining trading signals. Don't forget to set a Stop Loss order to break even if the price moves in the right direction by 15 pips. This will protect against potential losses if the signal turns out to be false.
On Thursday, the Eurozone, Germany, and the U.S. will release service and manufacturing activity indices for May. Recall that in the U.S., internal ISM activity indices are published at the beginning of each month, which serve as the basis for market conclusions. European and German indices may be easily ignored by the market.
Today, traders may open new short positions targeting 1.1542 if the price consolidates below the 1.1615-1.1625 area. Long positions can be opened if the price consolidates above the 1.1657-1.1666 area, with targets at the Senkou Span B line and the 1.1750-1.1760 area. On the 4-hour timeframe, a signal in the bearish FVG of 1.1628-1.1636 is required to open short positions.


