یہ بھی دیکھیں

 19.01.2026 12:35 AM
The US dollar is supported by strong fundamental factors. The combination of labour-market resilience and robust retail sales last week supports the view that the Fed will keep interest rates unchanged in the coming months.
President of the Federal Reserve Bank of Chicago, Austan Goolsbee, emphasized that, even despite labour-market stability, the central bank must focus on bringing down inflation. At the same time, President of the Federal Reserve Bank of San Francisco Mary Daly said that, at the moment, monetary policy is well-positioned to respond to changes in economic conditions.
Fresh US data illustrate this: initial jobless claims from the Department of Labor fell to 198,000 for the week ending January 10, down from 207,000 the previous week. In the manufacturing sector, the New York business activity index recovered to 7.7 in January after a contraction in December, and the Philadelphia Fed's manufacturing business activity index jumped sharply to 12.6, well above expectations, underscoring a strong start to the year for industrial activity.
The Canadian dollar finds support in an escalation of geopolitical risks. According to Reuters, Ukraine has intensified strikes on Russian oil tankers; in the Baltic Sea, drones and missiles struck at least six vessels. These events have heightened concerns about global oil supplies and pushed prices higher, which typically supports the Canadian dollar. Thus, in the near term, the positive correlation between energy prices and the Canadian currency remains the main factor for the Canadian dollar.
The further trajectory of USD/CAD will depend on the balance between support for the Canadian dollar driven by the oil market and the continuing strength of US fundamentals, as markets await new macro data and further guidance from Fed officials.
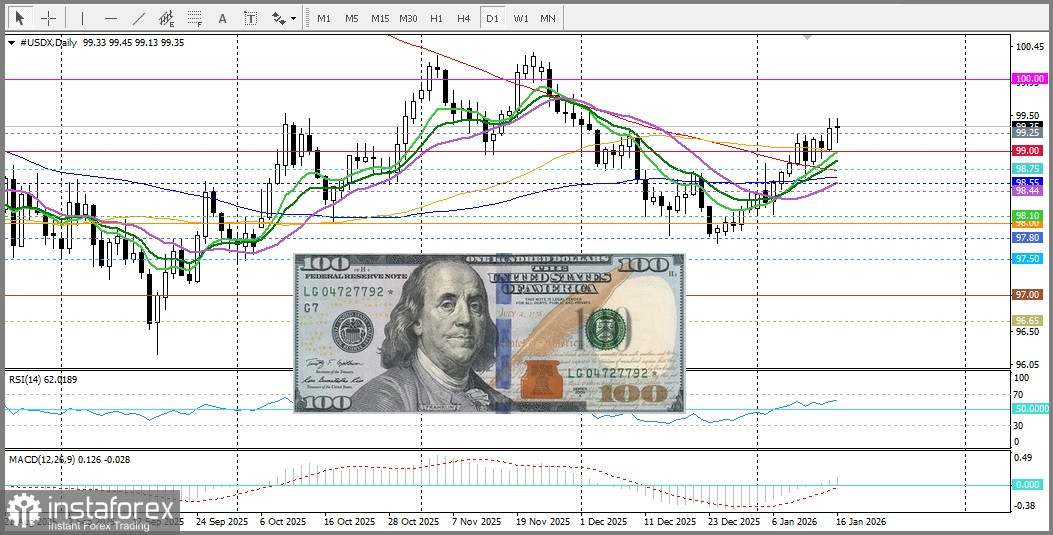
From a technical point of view, prices attempted to break the 1.3920 resistance. If prices hold above this resistance, they will accelerate their rise toward the round level of 1.4000. But if prices fall below the round level of 1.3900, the decline will accelerate toward the 200-day SMA. For now, daily chart oscillators are positive, and bulls have the advantage.
You have already liked this post today
*تعینات کیا مراد ہے مارکیٹ کے تجزیات یہاں ارسال کیے جاتے ہیں جس کا مقصد آپ کی بیداری بڑھانا ہے، لیکن تجارت کرنے کے لئے ہدایات دینا نہیں.


