یہ بھی دیکھیں

 26.12.2025 06:48 AM
Bitcoin has also been relatively inactive in recent days. Volatility in the cryptocurrency market has diminished during the holiday season, but the upward correction may be coming to an end. This means that a new decline could start at any moment. On the 4-hour timeframe, Bitcoin is once again in sideways movement. Within the range, trading opportunities should be sought only near the channel's boundaries. We see that signals have been received only around the upper boundary, two deviations. A deviation formed near the lower boundary could indicate growth potential, but we remind you that we are primarily interested in sell signals, not buy signals. If Bitcoin manages to establish itself below the range soon, we can again consider any "bearish" patterns for short trades.
The market, aside from various "crypto experts" who always predict growth, continues to cool down. It is evident that after three years of growth, it is time for profit-taking, seeking alternative investment tools, and taking a bit of a pause. Overall, the cryptocurrency market is in a lull right now. It is worth noting that for most of the time, almost any market and instrument is either in correction or flat. Thus, we should expect a trend resumption while waiting for trades at the boundaries of the flat.

On the daily timeframe, Bitcoin continues to form a downward trend, and the correction might be complete. The trend structure is identified as downward; the June "bullish" order block was addressed, the April bullish FVG has been surpassed, and the $84,000 level (38.2% on the Fibonacci retracement), which we highlighted as a target, has been reached. Further, Bitcoin could decline to as low as $60,000, where it began its last ascent. During the last phase of decline, a small bearish FVG was formed, which serves as the only Point of Interest (POI) for new sales. However, Bitcoin has not yet addressed this pattern.
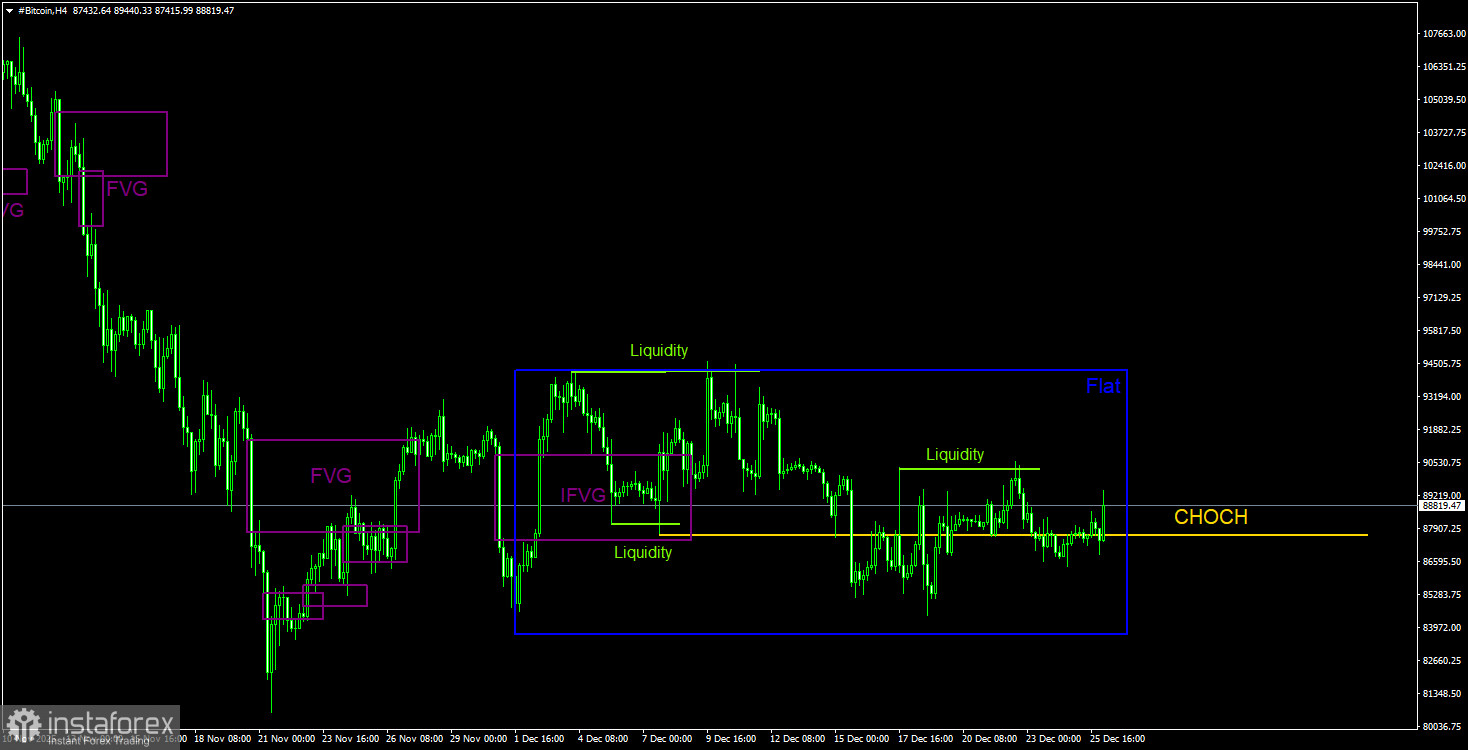
On the 4-hour timeframe, the technical picture also clearly indicates a downward trend, and the price still resides in the updated sideways channel. The CHOCH line (change of character) at the $87,600 level has been broken; therefore, the short-term upward trend has been broken. However, within the flat, local trends do not matter. In the near future, traders can only engage in trading from the boundaries of the channel. Moreover, sell signals are much more attractive than buy signals. Formally, two sell signals have already been generated. Thus, we can still expect a decline toward the lower line of the flat. The latest liquidity grab also indicates a continuation of the downward movement.
Bitcoin has broken the upward structure on the daily timeframe and is forming a full-fledged downward trend for the first time in three years. The two nearest targets (the bullish OB in the range of $98,000–$102,700 and the bullish FVG) have been addressed, and we should now expect a drop to $70,800 (the 50.0% level on the Fibonacci retracement from the three-year upward trend). The nearest POI for selling includes the closest bearish FVG on the daily timeframe, located in the range of $96,800 – $98,000, which Bitcoin has not yet managed to reach. On the 4-hour timeframe, short positions could have been opened near the upper line of the sideways channel after deviations, but there are currently no new signals.


