یہ بھی دیکھیں

 11.12.2025 11:00 AM
Trend Analysis (Fig. 1)
On Thursday, from the level of 1.1694 (yesterday's daily candle close), the market may begin moving downward toward the target of 1.1672 – the 14.6% retracement level (red dotted line). When testing this level, the price may rebound upward toward the target of 1.1717 – the 38.2% retracement level (blue dotted line).
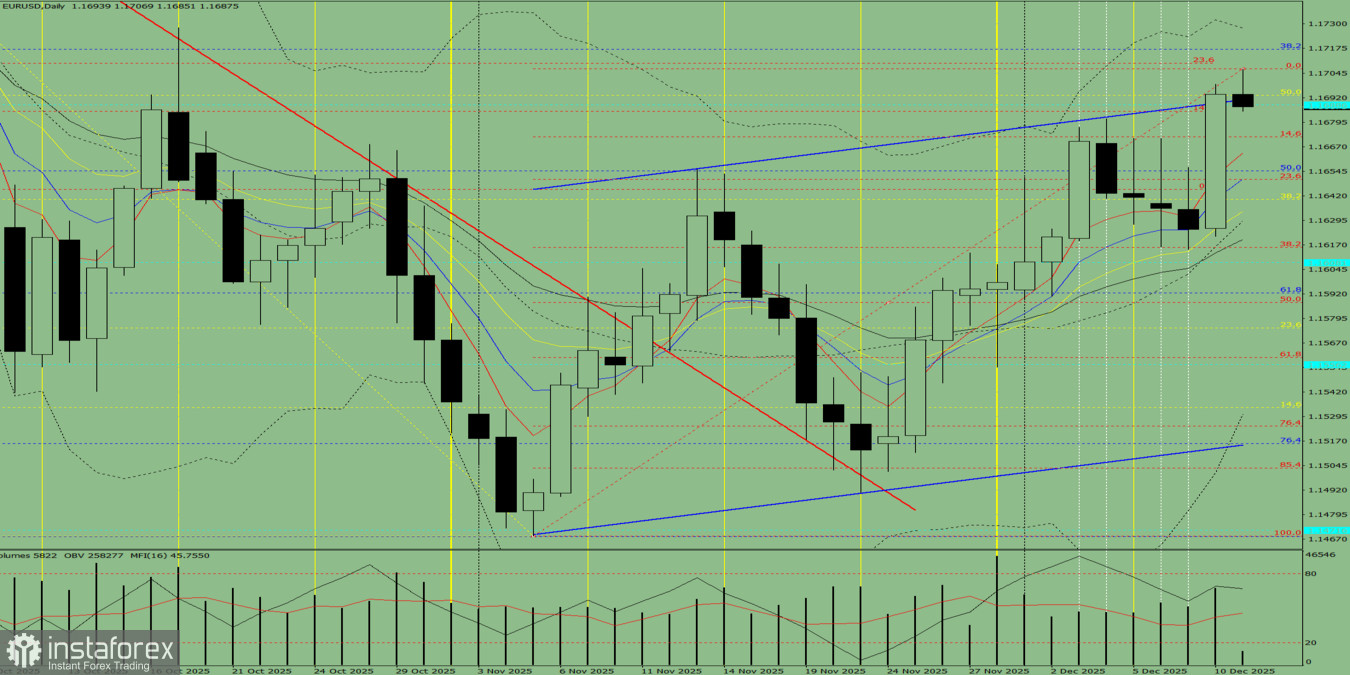
Fig. 1 (Daily Chart)
Comprehensive Analysis:
Overall conclusion: a downward trend.
Alternative Scenario:On Thursday, from the level of 1.1694 (yesterday's daily candle close), the market may begin moving downward toward the target of 1.1664 – the 5-period EMA (thin red line). When testing this line, the price may rebound upward toward the target of 1.1717 – the 38.2% retracement level (blue dotted line).
You have already liked this post today
*تعینات کیا مراد ہے مارکیٹ کے تجزیات یہاں ارسال کیے جاتے ہیں جس کا مقصد آپ کی بیداری بڑھانا ہے، لیکن تجارت کرنے کے لئے ہدایات دینا نہیں.


