یہ بھی دیکھیں

 22.09.2023 05:52 AM
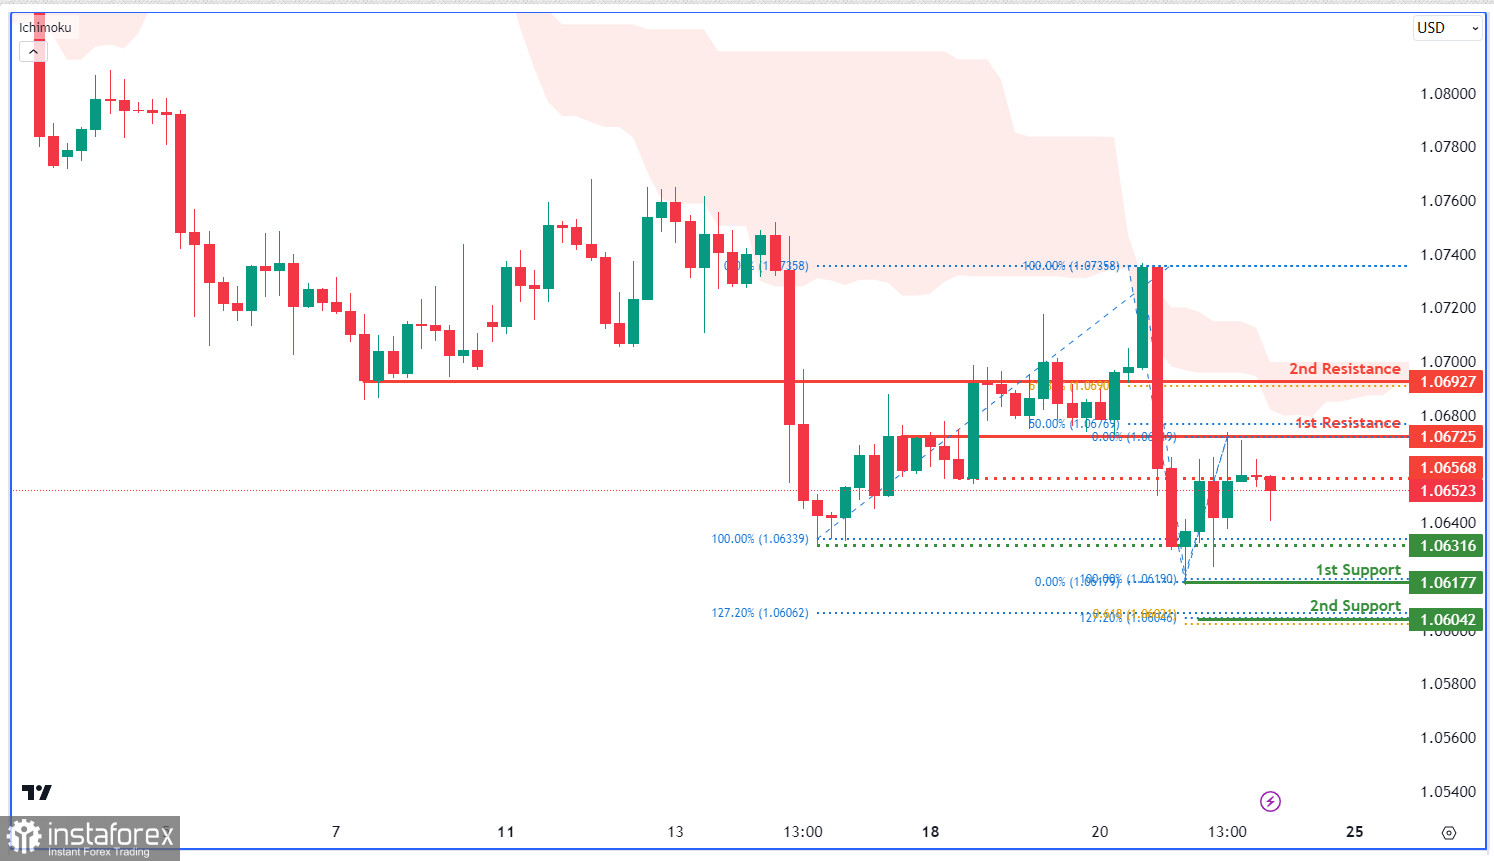
The EUR/USD chart shows a bearish trend, emphasized by its position below the bearish Ichimoku cloud. The price may decline towards the 1st support at 1.0617, a significant swing low support with Fibonacci confluence. The 2nd support at 1.0604 also has Fibonacci confluence. Resistance levels stand at 1.0672, an overlap resistance with a 50% Fibonacci Retracement, and 1.0692, a pullback resistance with a 61.80% Fibonacci Retracement, plus an intermediate resistance at 1.0656.
You have already liked this post today
*تعینات کیا مراد ہے مارکیٹ کے تجزیات یہاں ارسال کیے جاتے ہیں جس کا مقصد آپ کی بیداری بڑھانا ہے، لیکن تجارت کرنے کے لئے ہدایات دینا نہیں.


