
Lihat juga


 21.10.2026 04:45 AM
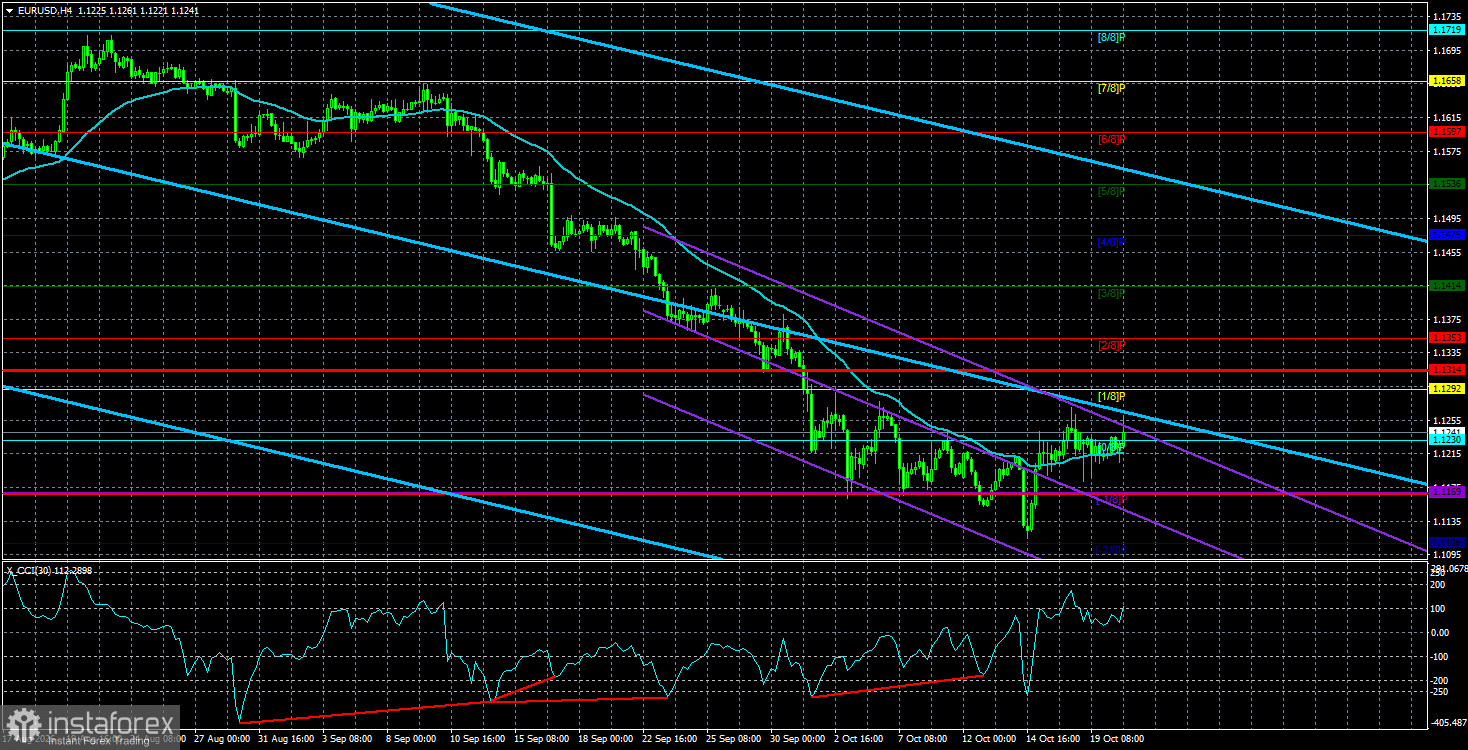
The EUR/USD pair traded calmly again on Tuesday. It's not that the euro has managed a convincing rally in recent days, but the lack of further decline is already good news for the single currency. Over the past five weeks, the euro has only moved down, and the market used any pretext to sell. Formally, traders had reasons to sell late last week: US CPI surprised higher, US PPI surprised higher, and then on Friday Kevin Warsh declined to comment on the policy outlook — which traders interpreted as mildly dollar-dovish, though it could have gone the other way. Then protests in France escalated into riots and looting, and unrest spread to other EU countries. So if the market wants, it can resume selling the euro and keep ignoring all euro-positive factors.
Notably, global banks have started flagging the euro's irrational weakness over the last one to two months. Many now forecast the euro will end 2026 well above current levels — average forecasts cluster around $1.15–1.16 per euro. In our view, expecting euro strength in the remaining 2.5 months of the year is reasonable and even necessary. Remember: absent the "black swan" of the Middle East war, the dollar would not have enjoyed such high demand. Many factors that pressured the dollar in 2025 remain: Trump's trade policies and widening trade conflicts; controversial migration and domestic policies that triggered protests; protectionist stances that pushed partners away; rapidly rising public debt; and persistent deficits. The administration has created more problems than it solved.
Add Trump's battles with the Federal Reserve — calls to cut the policy rate, attempts to remove officials, and policies intended to weaken the dollar to boost the trade balance — and it becomes hard to expect sustained long-term dollar strength while he remains president. That said, nothing prevents a renewed geopolitical shock if the administration chooses military action somewhere. In that event, investors would again flee risk and buy safe havens. How and when the conflict with Iran resolves is impossible to predict; escalation into neighboring states is a real risk. So we do not claim dollar increases are impossible — they will be understandable if new "black swans" hit the market — but such shocks cannot be predicted in advance.
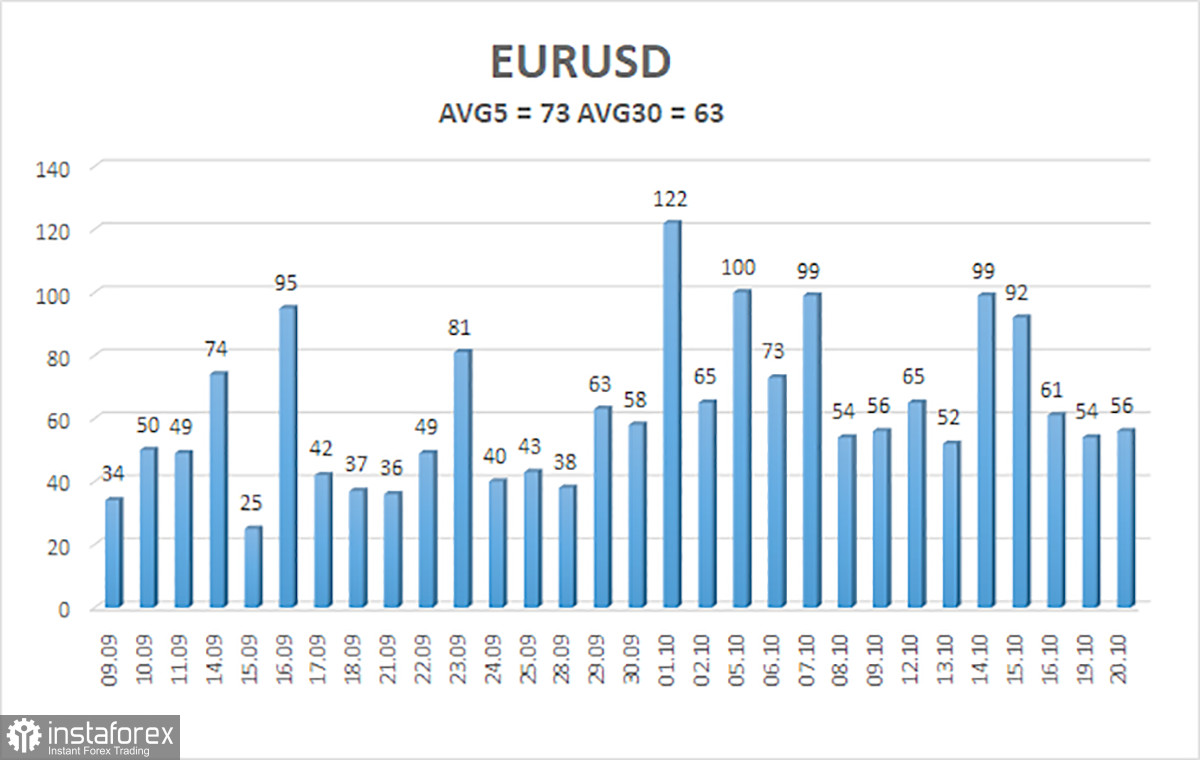
The average volatility of the EUR/USD currency pair over the last 5 trading days as of October 21 is 73 pips and is characterized as "average." We expect the pair to move between 1.1168 and 1.1314 on Wednesday. The higher linear-regression channel has turned down, indicating another trend change. The CCI indicator entered the oversold area five times and formed four "bullish" divergences, which warns that the illogical downtrend may be ending. However, the market is still only weakly responsive to technical signals.
S1 – 1.1230
S2 – 1.1169
S3 – 1.1108
R1 – 1.1292
R2 – 1.1353
R3 – 1.1414
EUR/USD continues to move lower, but we still view the decline as a correction ahead of a new uptrend. The global fundamental backdrop for the dollar remains negative, yet in 2026, geopolitics and then the Fed's hawkish tilt provided strong support for the US currency. With price positioned below the moving average, consider short positions targeting 1.1169 and 1.1108. Above the moving average, long positions are appropriate with targets at 1.1314 and 1.1353.


