यह भी देखें

 03.11.2025 11:11 AM
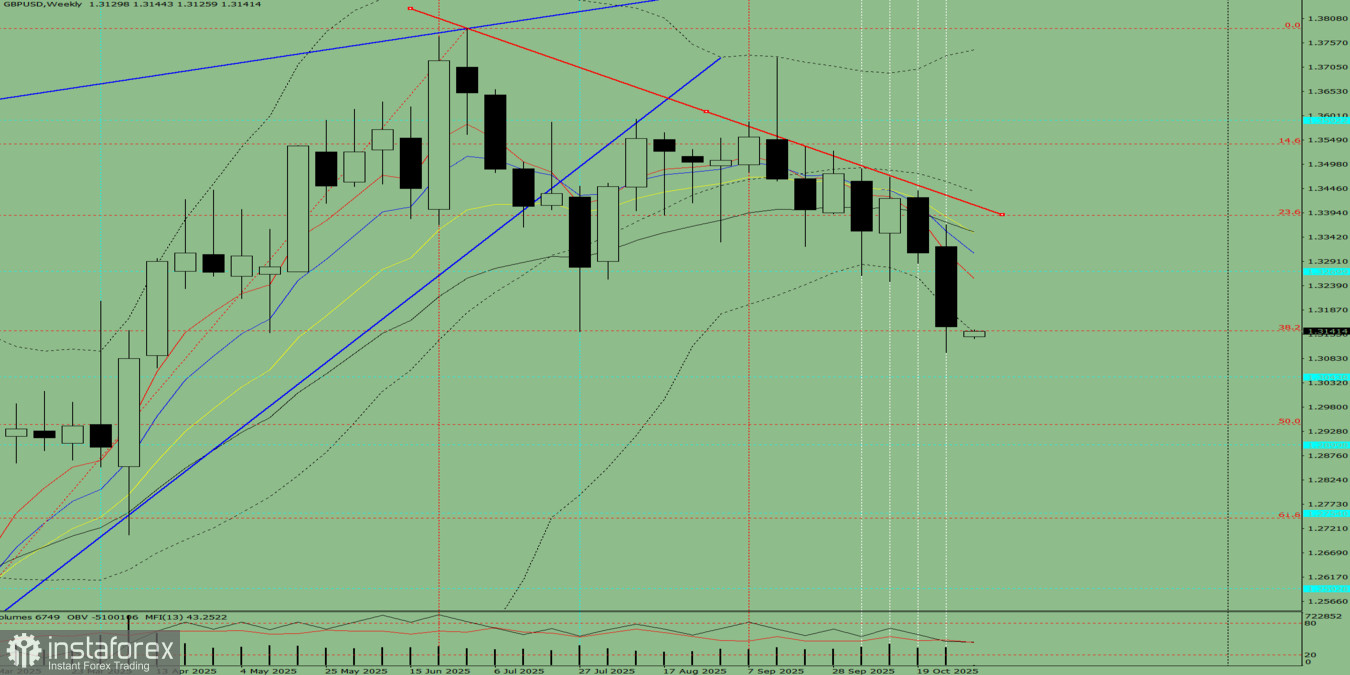
Fig. 1 (Weekly Chart).
Comprehensive Analysis:
Overall summary of the weekly GBP/USD candle calculation:The price will most likely show a downward trend during the week, with the first upper shadow forming on the weekly black (bearish) candle (Monday – upward movement), and the second lower shadow forming later (Friday – upward movement).
Alternative scenario:From the 1.3151 level (closing of the last weekly candle), the price may continue moving downward toward 1.2900 – a historical support level (light blue dashed line). Upon reaching this level, a rebound upward toward 1.2943 – the 50% retracement level (red dashed line) – is possible.
You have already liked this post today
*यहां पर लिखा गया बाजार विश्लेषण आपकी जागरूकता बढ़ाने के लिए किया है, लेकिन व्यापार करने के लिए निर्देश देने के लिए नहीं |

