यह भी देखें

 20.09.2023 07:42 AM
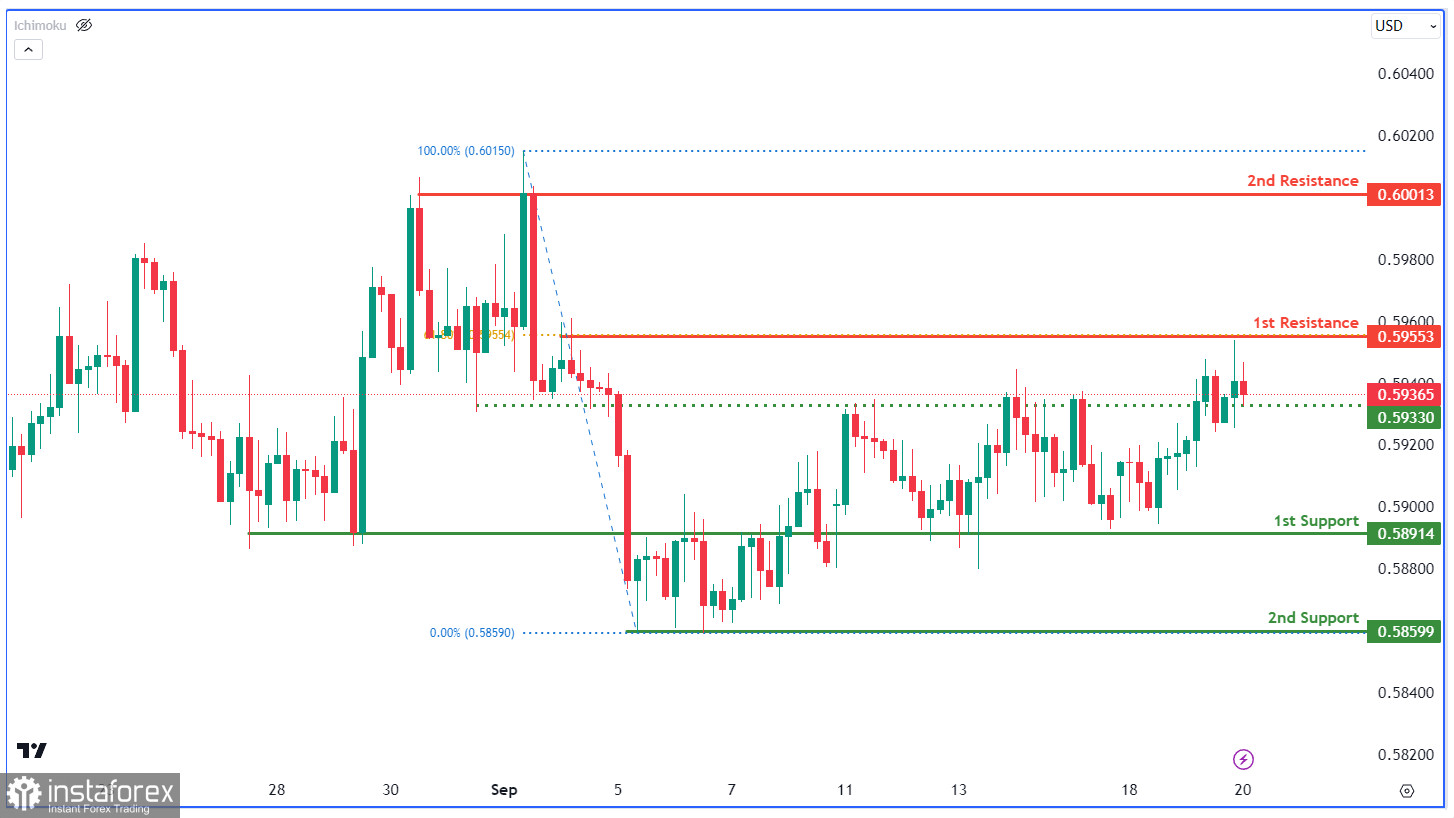
The NZD/USD chart shows a mild bearish trend, with a potential decline to the 1st support at 0.5891 if it breaks the intermediate overlap support at 0.5933. The 2nd support is at 0.5859, termed as a pullback. Resistance levels stand at 0.5955, aligning with the 61.80% Fibonacci retracement, and 0.6001, a multi-swing-high resistance.
You have already liked this post today
*यहां पर लिखा गया बाजार विश्लेषण आपकी जागरूकता बढ़ाने के लिए किया है, लेकिन व्यापार करने के लिए निर्देश देने के लिए नहीं |

