
আরও দেখুন


 21.10.2026 01:34 PM
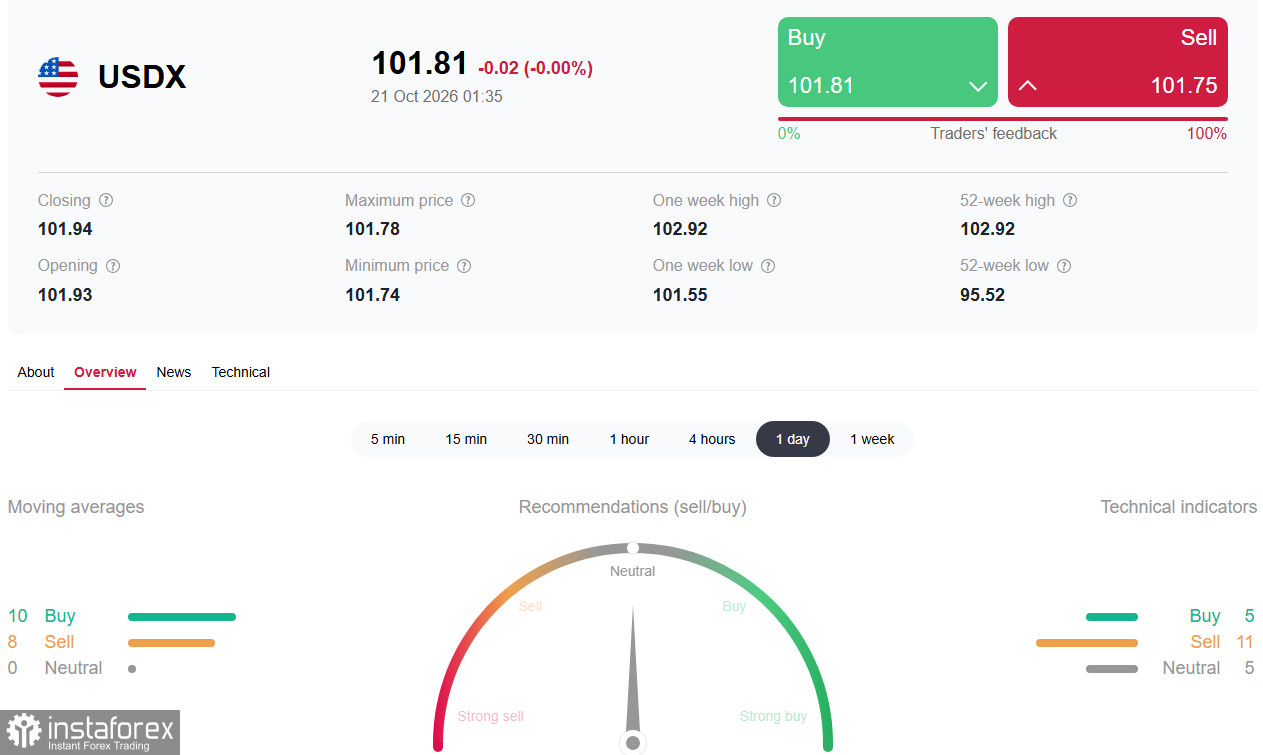
See also: InstaTrade trading indicators for USDX
As of Wednesday, October 21, 2026, the US dollar index (DXY) trades in a tight range near 101.60, around which the short-term resistance of the 50-hour EMA on the hourly chart runs, as the index seeks direction after a pullback from the 18-month high reached on October 14 above 102.70. The paradox: hot inflation prints (CPI 3.7%, PPI 6.3%) failed to keep the dollar at its peak because the market has fully switched focus to the upcoming FOMC meeting and Fed rhetoric. The index is pinned between support of the rising hourly channel and the 50-hour EMA, and market participants prefer not to make bold bets until the central bank's position becomes clearer.
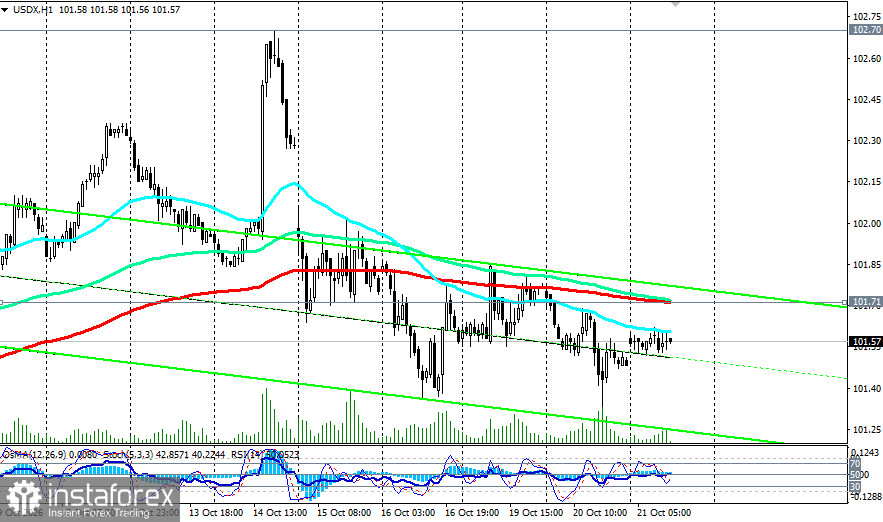
In early European trading, USDX also shows subdued dynamics. After hitting a nearly three-week low on Tuesday (around 101.30), the index recovered to 101.50–101.60, but bullish conviction is clearly lacking. The 10-year US Treasury yield holds around 5.12–5.13%, recovering after a dip to 5.09% on Tuesday. WTI trades near $99/bbl, and Brent is around $108/bbl, as supply fears from the Middle East persist.
Key drivers
The Fed enters a blackout period, and the market loses guidance. After Fed chair Kevin Warsh's speech last week, markets sharply cut the odds of an October rate hike—from roughly 27% to under 15%. Warsh declined to pre-announce decisions for the October and December meetings, saying, "I do not pre-determine meeting outcomes." His tone was less hawkish than expected. Still, market sentiment toward the Fed remains firmly in hawkish territory.
Geopolitics creates uncertainty but no clear directional impulse. Reports of a possible compromise plan by Qatar and Pakistan for US–Iran talks temporarily weakened the dollar but were later denied by a negotiating diplomat. Iran warned it could expand a blockade to the Bab el-Mandeb Strait and the Suez Canal, supporting an oil risk premium. This is a two-edged sword for the dollar: geopolitics supports demand for safe-haven assets while higher oil boosts inflation expectations and strengthens arguments for Fed tightening.
Housing data disappointed. Housing starts in September fell to 1.221m versus a 1.3m forecast, and existing home sales plunged 7.3% to a record low. Weak housing figures argue against a rate hike and limit dollar upside.
Brief technical analysis
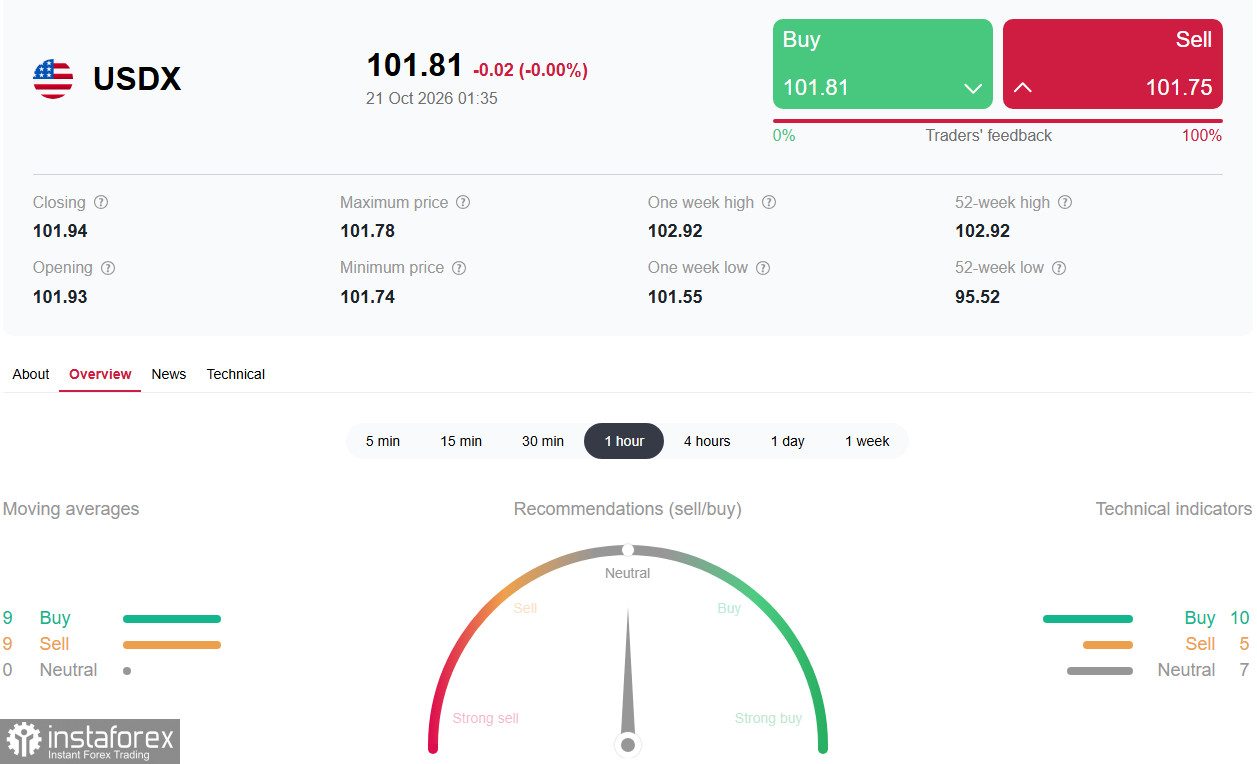
-
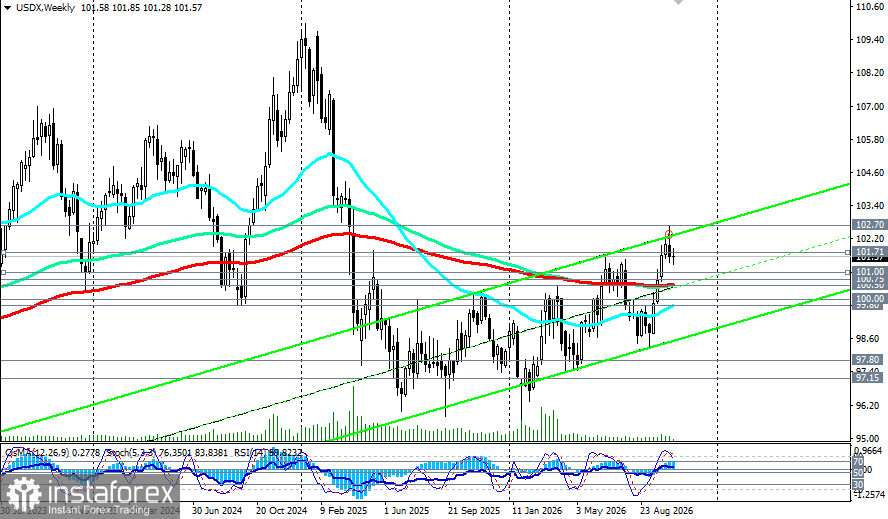
term technical picture remains neutral with a slight bearish bias; neither bulls nor bears have conviction.InstaForex's aggregated technical analysis on daily and hourly charts also points to a neutral stance.
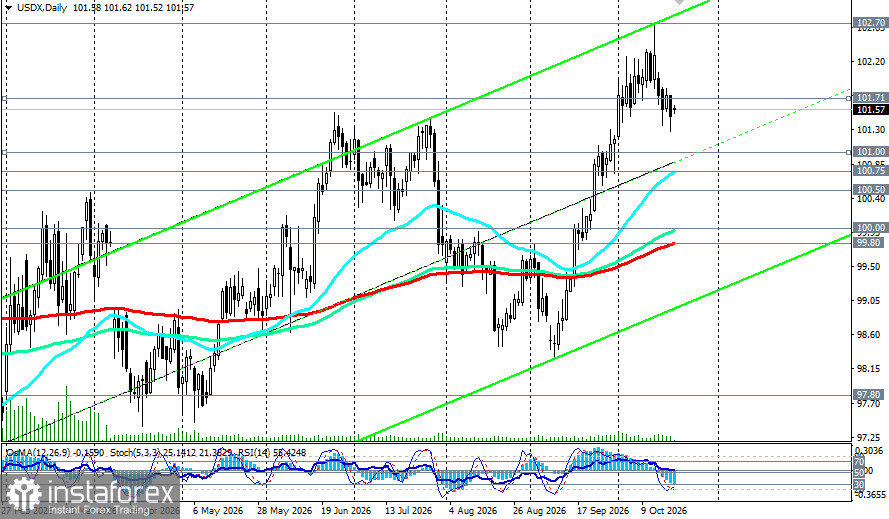
- RSI (14) on the daily chart sits around 55—positive but not overbought, indicating a steady yet weak bullish bias.
- The OsMA histogram is below zero and, together with Stochastic now leaving oversold territory, sends negative signals.
- EMA 50, 144, and 200: price remains above the 50-day EMA (about 100.75), preserving a short-term bullish bias. The 144- and 200-period EMAs lie well below current levels (around 100.00 and 99.80), forming long-term support.
See more: USDX—possible dynamics on 21.10.2026
Key events to watch
Wednesday, October 21, 14:30 GMT — US EIA crude inventories. Expected draw: -0.3m bbl versus prior -8.56m. A large inventory draw would support oil and inflation expectations and could limit dollar downside.
Thursday, October 22, 12:30 GMT — US initial jobless claims. In a media survey, 94 of 100 economists expect no move in October, and all 100 expect a December hike. Claims will offer the last meaningful labor market signal ahead of the FOMC.
Friday, October 23, 13:45 GMT—preliminary S&P Global PMIs for October. These prints can influence odds of a December hike that markets currently price at over 90%.
Tuesday–Wednesday, October 27–28—FOMC meeting. Markets price an 82–85% chance of no change. The statement tone and updated projections will determine dollar direction for the weeks ahead. Economists expect a December hike to be the last of the cycle.
Thursday, October 29—PCE index for September (Fed's preferred inflation gauge). This is the key release that can confirm or refute December hike expectations.
Conclusion and recommendations
The USDX is range-bound, awaiting a catalyst. Hot inflation provides a fundamental underpinning, but uncertainty around the Fed and geopolitics limits clear directional moves. Key level for bulls—102.00; for bears—101.20 and the critical zone 100.75 (50-day EMA on D1)—100.50 (200/144 EMA on W1).
For short-term traders:
- Consider longs on a sustained break above 102.00 with targets of 102.50–102.90 and a stop-loss below 101.20.
- Consider shorts on a break below 101.20 with targets of 101.00 (H4 200-EMA)–100.50 and a stop-loss above 102.00.
- Monitor PMI (Oct 23) and the FOMC (Oct 28) closely—these are key triggers.
For medium-term investors:
A potential pullback to 100.75–100.50 could be used to cautiously add long exposure while maintaining a constructive view on the dollar, but uncertainty over whether the Fed is finishing the tightening cycle calls for extra caution.
Risk management:
- Expect elevated volatility around the FOMC and inflation releases.
- Use strict stop-losses, especially on breakout trades of key levels.
- Watch bond yields, oil prices, and geopolitical news.
This overview is based on open sources and media reports and represents an analysis of price dynamics dependent on many factors; risk management and position control are therefore especially important.


