
আরও দেখুন


 14.10.2026 10:01 AM
On the hourly chart, GBP/USD reversed in favor of the pound on Tuesday and rose toward the 100.0% Fibonacci retracement level at 1.3272. A rebound from this level would favor the US dollar and a resumption of the decline toward the 1.3164–1.3177 support level. A close above 1.3272 would suggest further gains for the pound toward the next retracement level of 76.4% at 1.3368.
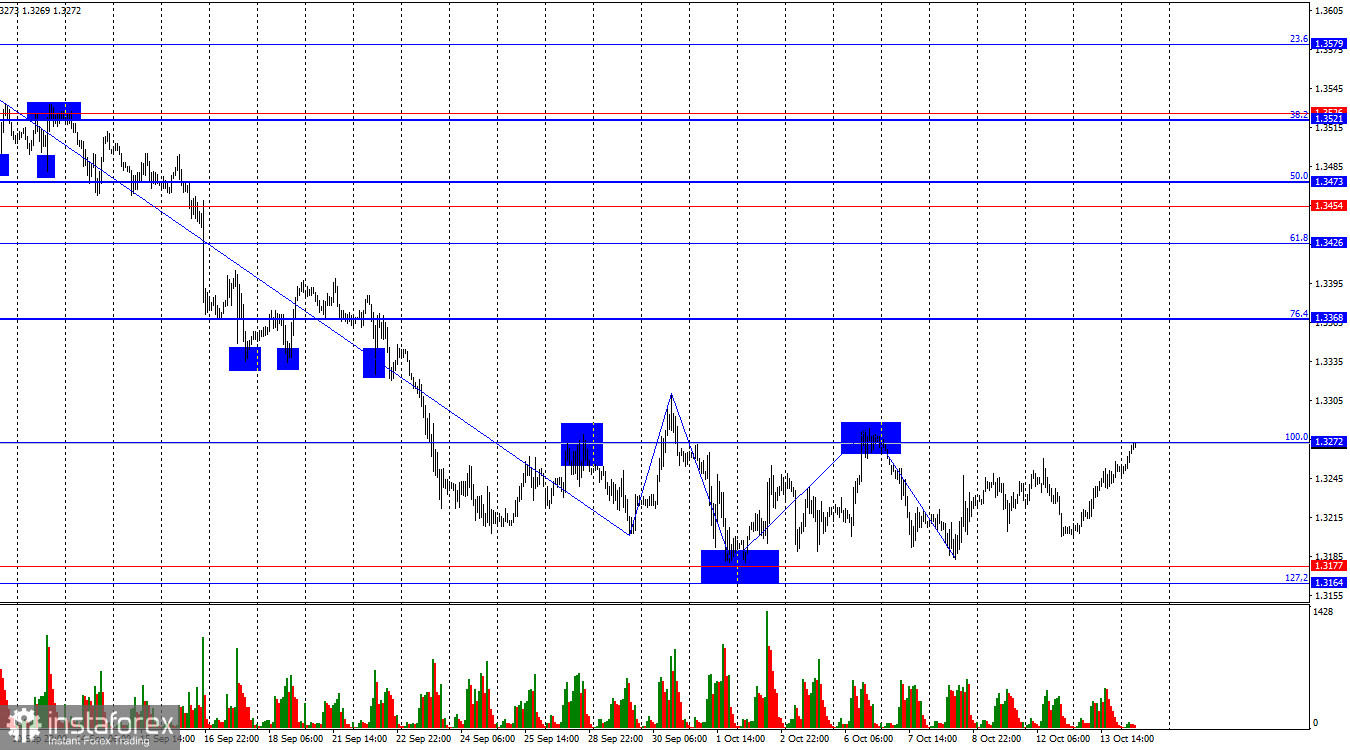
The market situation remains entirely bearish. The latest completed downward wave failed to break below the previous low, while the new upward wave failed to break above the previous high. Thus, bears continue to control the market. The FOMC's monetary policy tightening and the hawkish outlook communicated by Kevin Warsh continue to support the dollar. A reversal of the current trend is now possible only above 1.3284 or after the formation of two bullish waves.
The news background was very weak on Tuesday and had no impact on trader sentiment. Today, the US will release its September inflation report, which could influence the FOMC's next interest rate decision. The market is therefore likely to await this data before drawing conclusions. The market does not expect the Fed to tighten monetary policy further in October, but the faster inflation rises, the greater the likelihood of more than one rate hike in the future. Bank of England Governor Andrew Bailey is also scheduled to speak today. The head of the British central bank may signal that the Bank is prepared to begin tightening monetary policy at its next meeting. Thus, trading in the pound today will depend on these two events. In my view, traders have already priced in the Fed's hawkish stance, whereas the Bank of England's hawkish outlook has not yet been fully priced in. A close above 1.3272 followed by further gains in the pound would be the most logical scenario for this week. GBP/USD has been trading in a range for three weeks, and this range will eventually end.
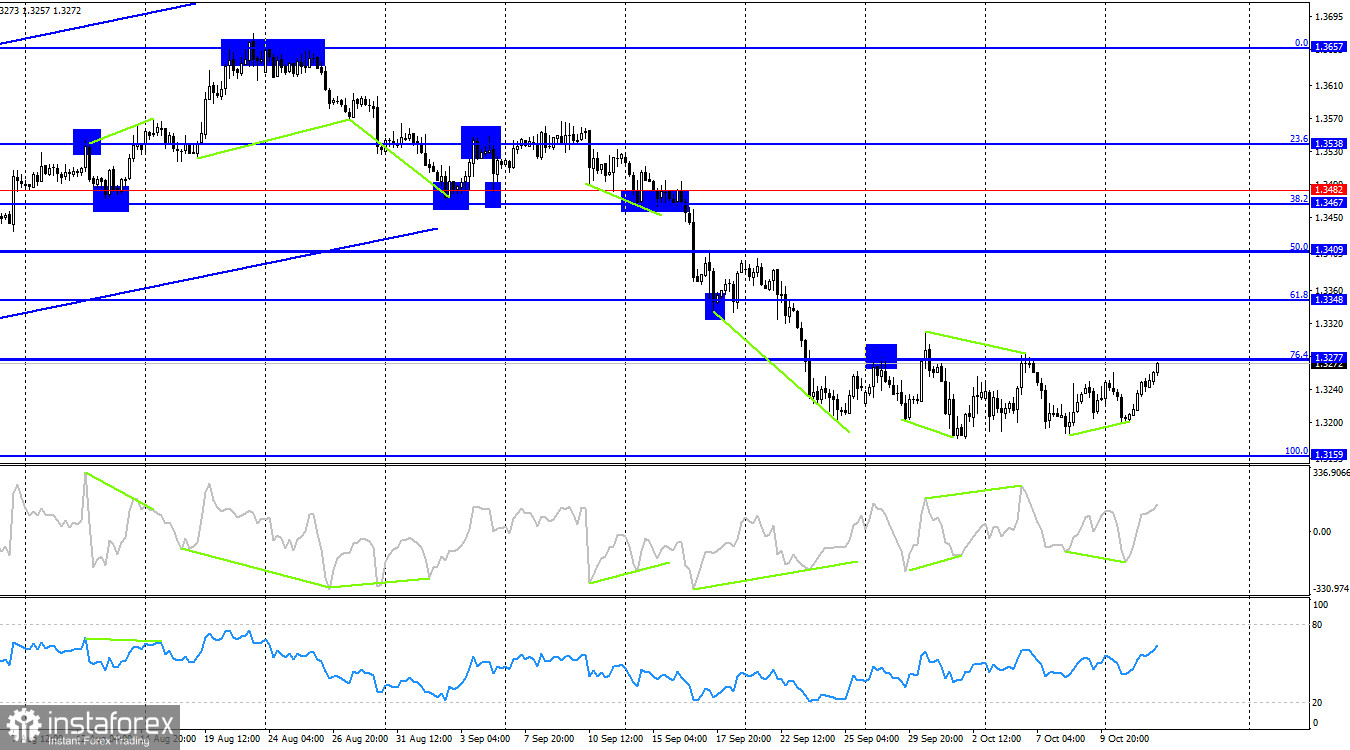
On the 4-hour chart, GBP/USD returned to the 76.4% Fibonacci retracement level at 1.3277 after another bullish divergence formed on the CCI indicator. A rebound from this level would favor a resumption of the decline toward the 100.0% Fibonacci level at 1.3159. A close above 1.3277 would give the pound hope for a modest recovery. The technical picture on the hourly chart is currently more convincing, so the hourly chart is the one to focus on.
Commitments of Traders (COT) Report:
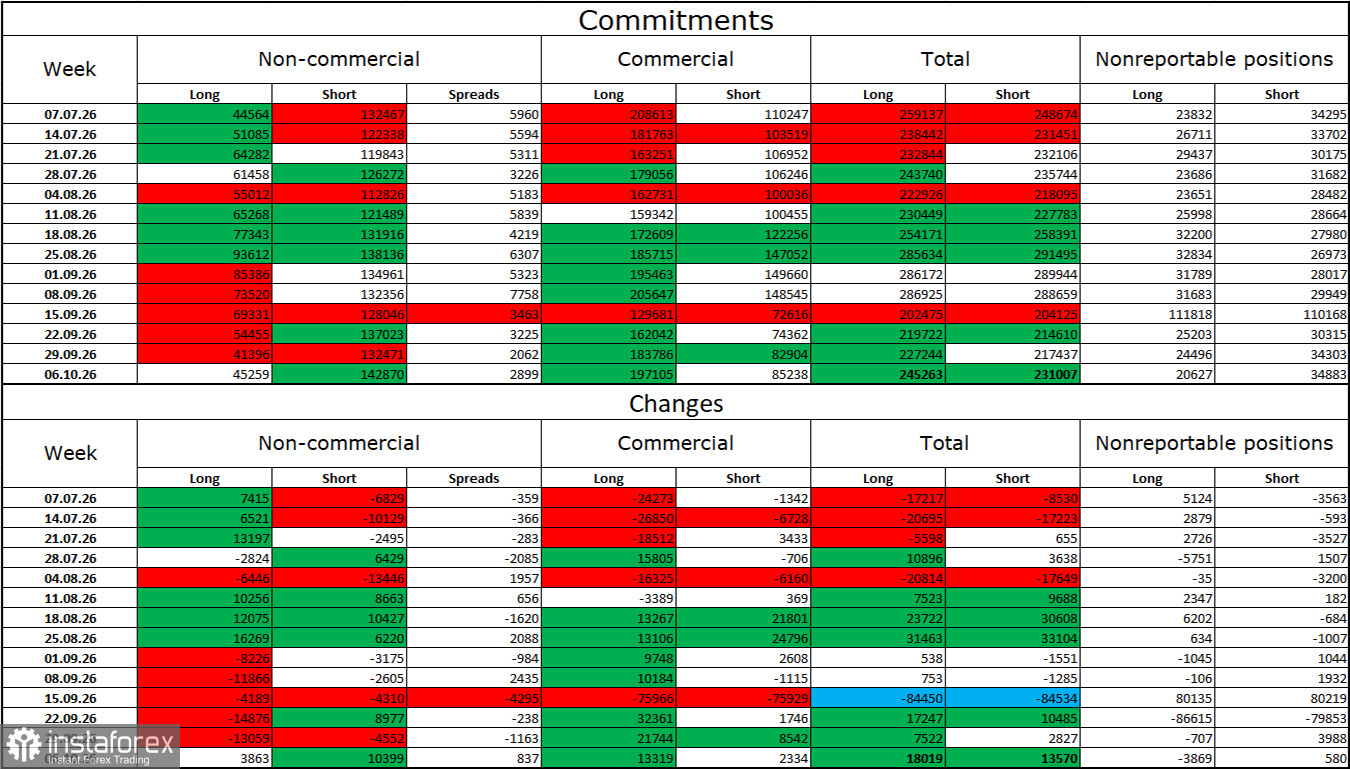
Sentiment among the Non-commercial trader category became even more bearish during the latest reporting week. The number of Long positions held by speculators increased by 3,863, while the number of Short positions rose by 10,399. The gap between Long and Short contracts currently stands at approximately 45,000 versus 143,000, respectively. The bears' advantage is widening again. Previously, bearish dominance was beyond question, but it is now less clear-cut because the news background has changed in recent months.
The bearish trend in the pound is still not convincing, but in the near term, everything will depend on Trump's trade policy, the monetary policies of the Fed and the Bank of England, and the duration, scale, and consequences of the war in the Middle East. In recent months, the market had shifted toward expectations of peace, but negotiations between Iran and the United States failed before they had properly begun. There is no guarantee that they will resume anytime soon.
US and UK Economic Calendar:
On October 14, the economic calendar contains one important release. Economic data are expected to influence market sentiment during the second half of Wednesday's trading session.
GBP/USD Forecast and Trading Advice:
Selling the pair is possible today if it rebounds from 1.3272 on the hourly chart, with a target of 1.3164–1.3177. Buying is possible today if the pair closes above 1.3272, with a target of 1.3368.
The Fibonacci levels are drawn from 1.3272 to 1.3674 on the hourly chart and from 1.3158 to 1.3655 on the 4-hour chart.


