
আরও দেখুন


 05.08.2026 05:26 AM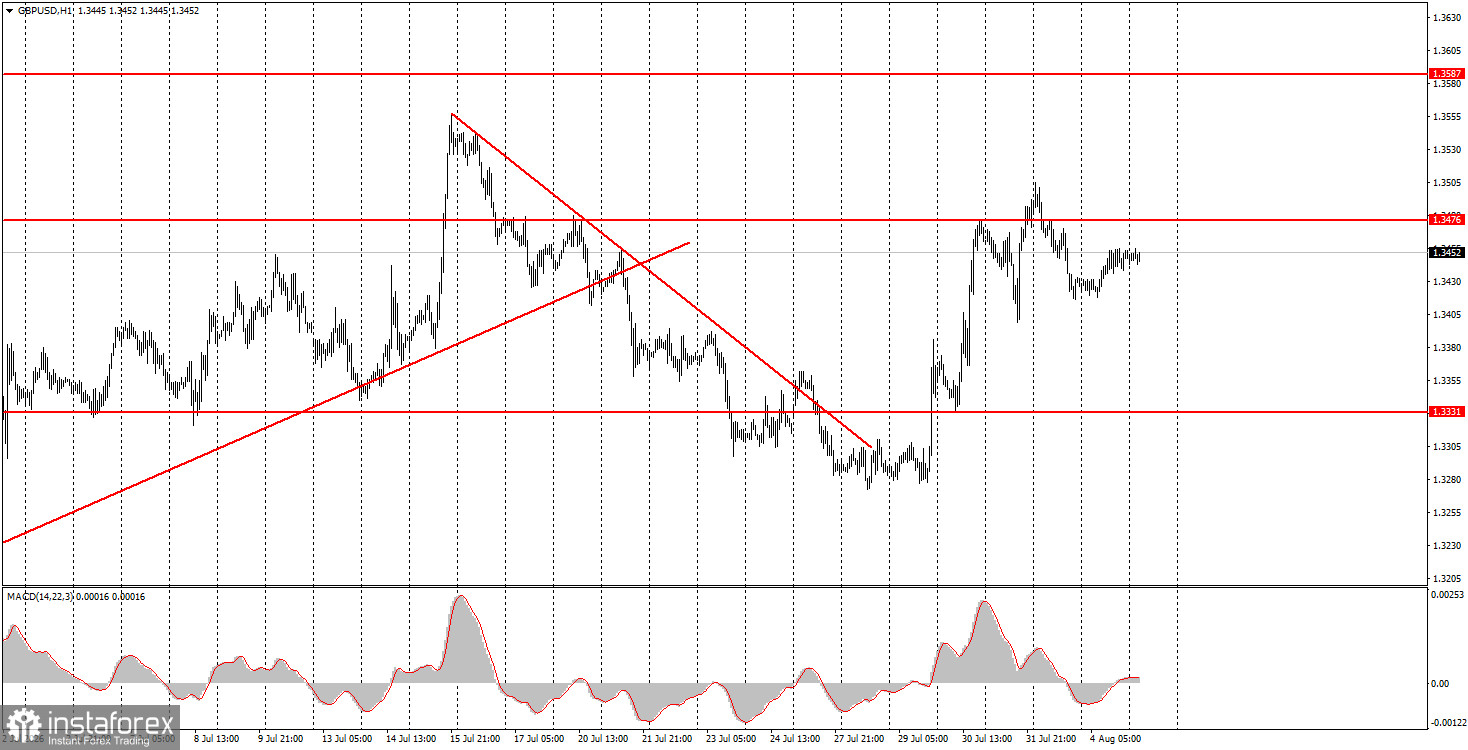
The GBP/USD pair showed no interesting movements on Tuesday, making it difficult to analyze. The market remains positioned to buy the British pound, as it has begun to grow disillusioned with the Federal Reserve and the dollar. Recall that a month and a half ago, the market was confident that the Fed would raise the key rate several times by the end of the year. But now, members of the Fed's Monetary Committee do not express a strong desire to tighten policy; inflation is slowing, the labor market is cooling, and the economy grew at 1.5% in the second quarter. We believe the Fed will keep the key rate unchanged in September as well.
Additionally, from a technical standpoint, any growth in the pair is justified. The dollar strengthened in 2026 solely due to geopolitical factors, a dynamic that cannot sustain it indefinitely. In the long term, an upward trend remains, while in the medium term, there is a flat. Within the sideways channel, the British pound began its movement from the lower boundary to the upper one a month ago.
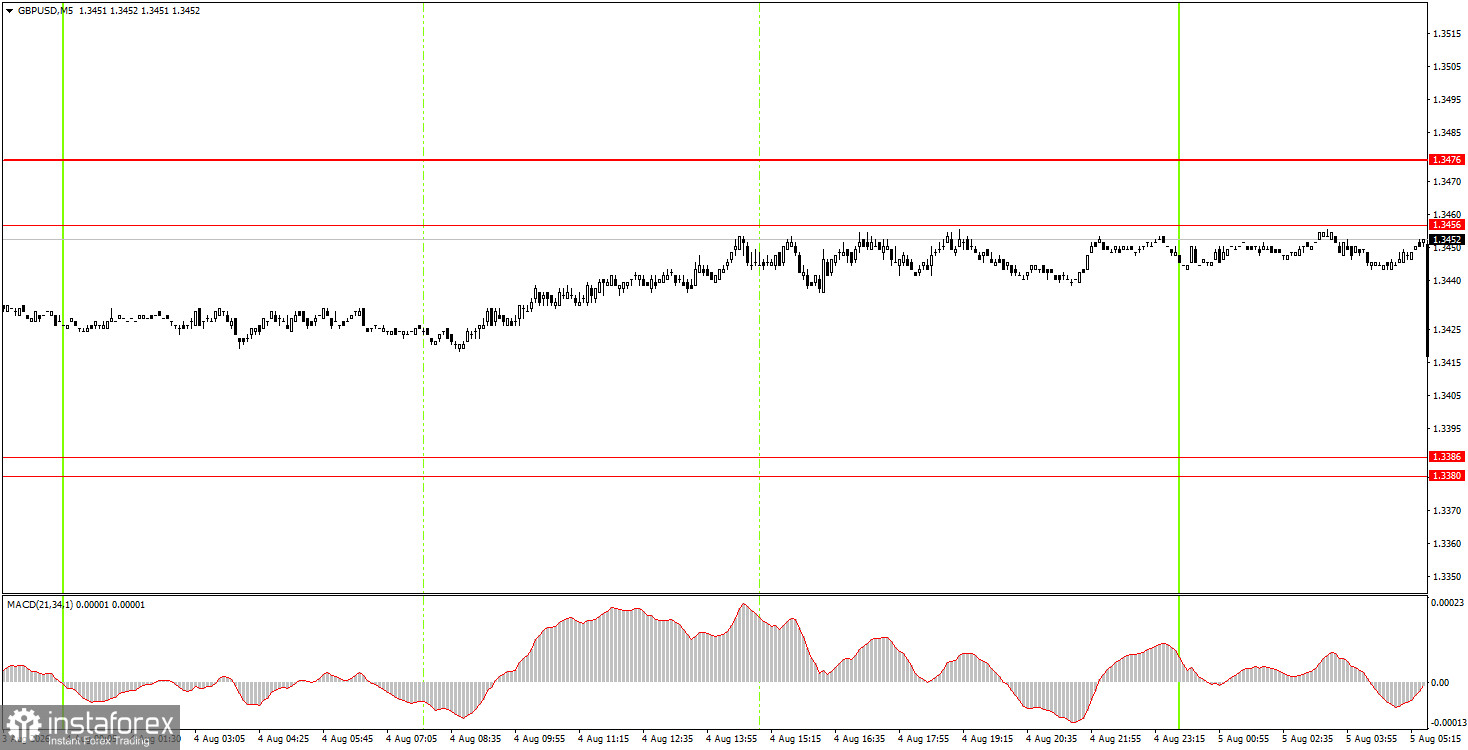
In the 5-minute timeframe, the price reached the 1.3456-1.3476 area at the start of the American session but failed to generate any trading signals by the end of the day. Volatility was virtually nonexistent. Formally, novice traders had grounds to open a short position, but the trade neither yielded a profit nor incurred a loss, as there was no movement in the market.
On the hourly timeframe, the GBP/USD pair maintains an upward trend. In our view, the British pound will continue to grow, even if local factors do not provide support. On the weekly timeframe, the move from the lower boundary of the sideways channel to the upper boundary began a month ago, and it is not yet complete. Belief in a rate hike by the Fed in September is fading; the market is no longer paying attention to geopolitics, and technical factors are supporting the British pound's gains.
On Wednesday, novice traders may open short positions if a bounce occurs in the 1.3456-1.3476 area, with a target of 1.3380-1.3386. Long positions can be considered if there is consolidation above the 1.3456-1.3476 area, with targets at 1.3587-1.3598.
On the 5-minute timeframe, the following levels should be considered for trading: 1.3096-1.3107, 1.3175-1.3180, 1.3259-1.3267, 1.3319-1.3331, 1.3380-1.3386, 1.3456-1.3476, 1.3587-1.3598, 1.3631-1.3641, 1.3695. On Wednesday, there are no significant events planned in the UK, while the U.S. will release the ADP report and the ISM services sector index. We believe that only the ISM Business Activity Index may provoke a market reaction.
Support and resistance price levels (areas) are the targets when opening buy or sell orders or sources of signals.
Red lines denote channels or trend lines that reflect the current trend and indicate in which direction trading is currently favored.
The MACD indicator (14,22,3) – histogram and signal line – is a supporting indicator that can also be used as a source of signals.
Important speeches and reports (as listed in the news calendar) can significantly influence the movement of the currency pair. Therefore, during their release, trading should be approached with utmost caution, or one should exit the market to avoid sharp price reversals against the preceding movement.
Beginners in Forex trading should remember that not every trade can be profitable. Developing a clear strategy and proper money management are essential for long-term trading success.


