আরও দেখুন

 21.09.2023 06:05 AM
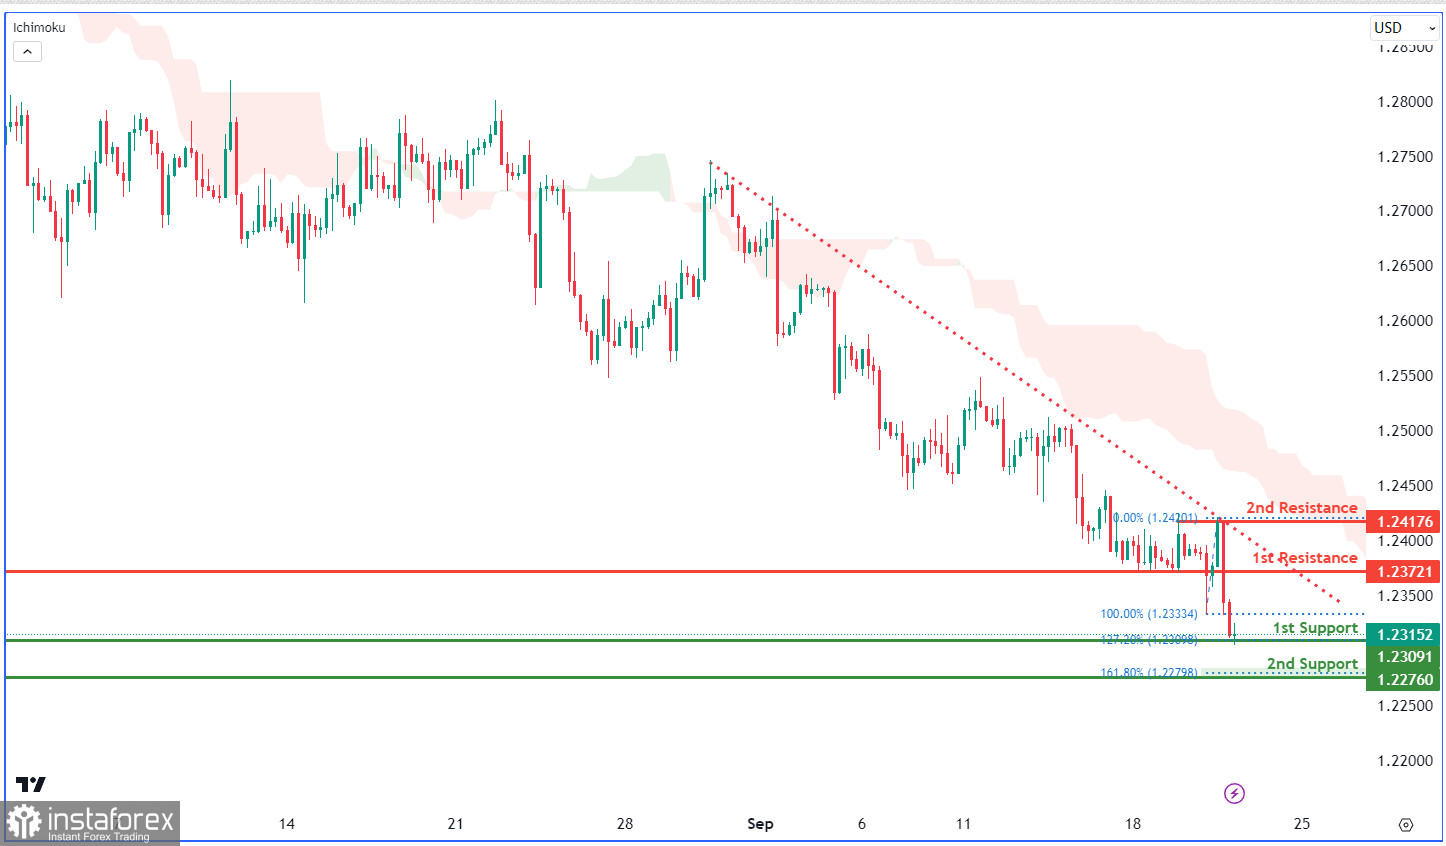
The GBP/USD chart displays a bearish trend, driven by its position below a descending trend line. It may briefly rise to the 1st resistance at 1.2372 before falling towards the 1st support at 1.2309, which is a swing low support aligning with the 127.20% Fibonacci Extension. The 2nd support is at 1.2276, aligning with the 161.80% Fibonacci Extension. On the resistance side, the primary level is at 1.2372, with the 2nd resistance at 1.2417, emphasizing their importance.
You have already liked this post today
*এখানে পোস্ট করা মার্কেট বিশ্লেষণ আপনার সচেতনতা বৃদ্ধির জন্য প্রদান করা হয়, ট্রেড করার নির্দেশনা প্রদানের জন্য প্রদান করা হয় না।


