আরও দেখুন

 20.09.2023 07:40 AM
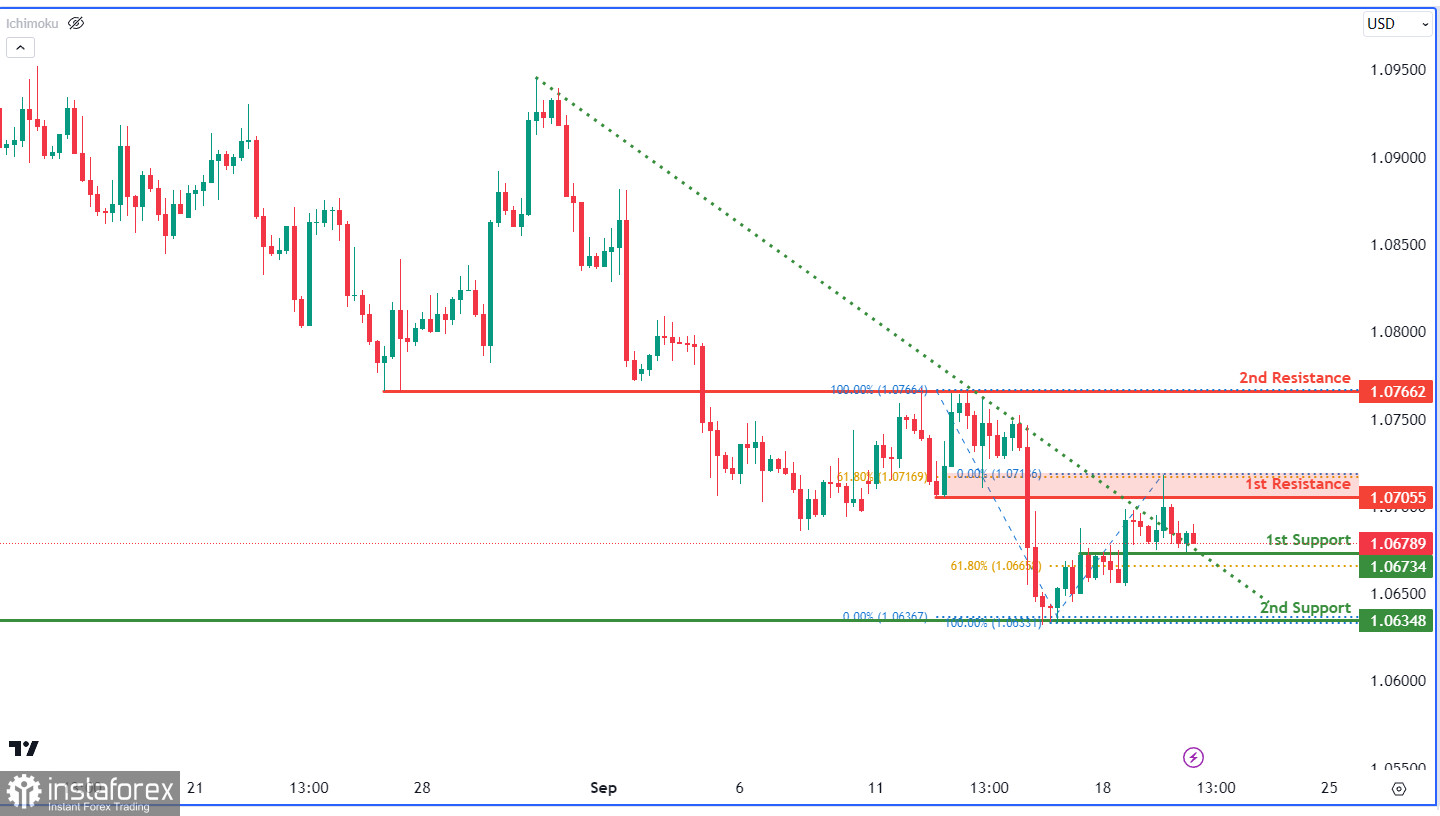
The EUR/USD chart displays a bullish trend, driven partly by a break above a descending resistance. The price may bounce at the 1st support of 1.0673, aligned with the 61.80% Fibonacci Retracement, and then aim for the 1st resistance at 1.0705. The 2nd support stands at 1.0634, a multi-swing low, while resistances at 1.0705 and 1.0766 are emphasized as overlap resistances, with the former also associated with the 61.80% Fibonacci Retracement.
You have already liked this post today
*এখানে পোস্ট করা মার্কেট বিশ্লেষণ আপনার সচেতনতা বৃদ্ধির জন্য প্রদান করা হয়, ট্রেড করার নির্দেশনা প্রদানের জন্য প্রদান করা হয় না।


