আরও দেখুন

 05.03.2026 06:53 AM
[#NDX]
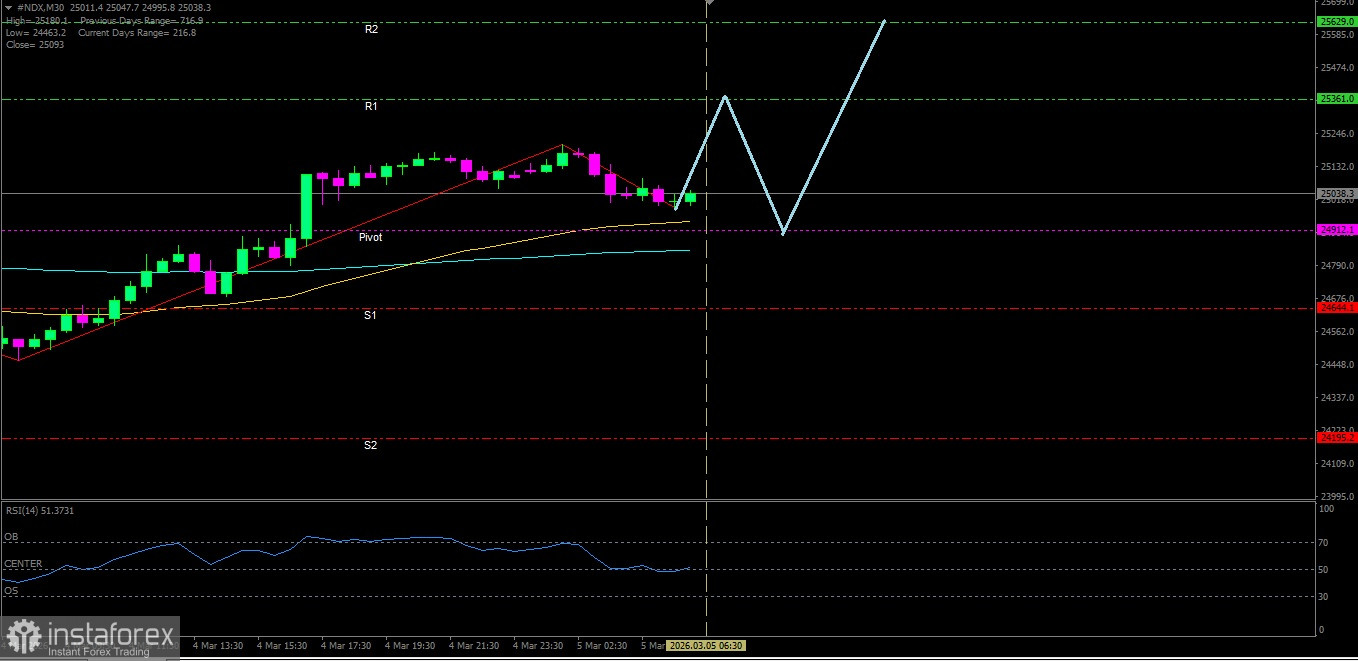
Although RSI(14) indicator is in the Neutral-Bearish area, but with both EMAs forming a Golden Cross gives the confirmation that the Nasdaq 100 index still has the potential to continue its strengthening.
Key Levels
1. Resistance. 2 : 25629.0
2. Resistance. 1 : 25361.0
3. Pivot : 24912.1
4. Support. 1 : 24644.1
5. Support. 2 : 24195.2
Tactical Scenario
Positive Reaction Zone: If the price breaks out above 25361.0, there is a likelihood of a move up toward 25629.0.
Momentum Extension Bias: If 25629.0 is broken, the Nasdaq 100 could attempt to test 26077.9.
Invalidation Level / Bias Revision
The upside bias weakens if #NDX falls below 24195.2.
Technical Summary
EMA(50) : 24939.0
EMA(200): 24841.5
RSI(14) : 48.34
Economic News Release Agenda:
Tonight the United States will release the following economic data:
US - Challenger Job Cuts y/y - 19:30 WIB
US - Unemployment Claims - 20:30 WIB
US - Import Prices m/m - 20:30 WIB
US - Prelim Nonfarm Productivity q/q - 20:30 WIB
US - Prelim Unit Labor Costs q/q - 20:30 WIB
US - Natural Gas Storage - 22:30 WIB
You have already liked this post today
*এখানে পোস্ট করা মার্কেট বিশ্লেষণ আপনার সচেতনতা বৃদ্ধির জন্য প্রদান করা হয়, ট্রেড করার নির্দেশনা প্রদানের জন্য প্রদান করা হয় না।


