Vea también

 21.10.2025 09:59 AM
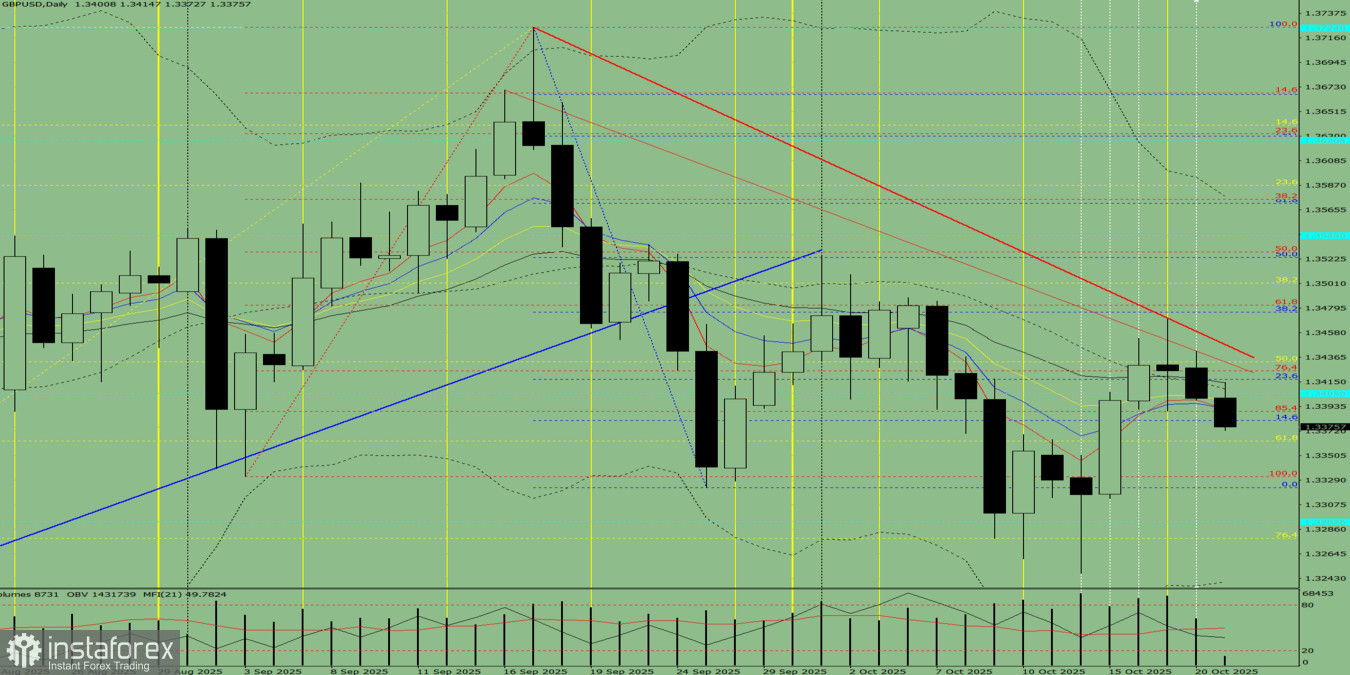
Fig. 1 (Daily Chart)
Comprehensive Analysis:
Overall conclusion: Downward trend.
Alternative scenario: From the 1.3400 level (yesterday's daily candle close), the price may start moving downward toward 1.3363 – the 61.8% retracement level (yellow dashed line). Upon testing this line, the price may possibly start moving upward toward 1.3381 – the 14.6% retracement level (blue dashed line).
You have already liked this post today
*El análisis de mercado publicado aquí tiene la finalidad de incrementar su conocimiento, más no darle instrucciones para realizar una operación.


