
Vea también


 12.10.2026 07:38 AM
The daily chart for Gold (GOLD) shows the price continuing to trade within a clear bearish range defined by a sub-channel. This follows a previous sell-off triggered by a correction from the peak recorded near the second monthly resistance level (Monthly R2) at 4659.09. The price is currently trading around the 4185.35 level, subject to cautious, sideways pressure between the lower support zones and the upper boundary of the sub-channel.
Technical Analysis and Price Action
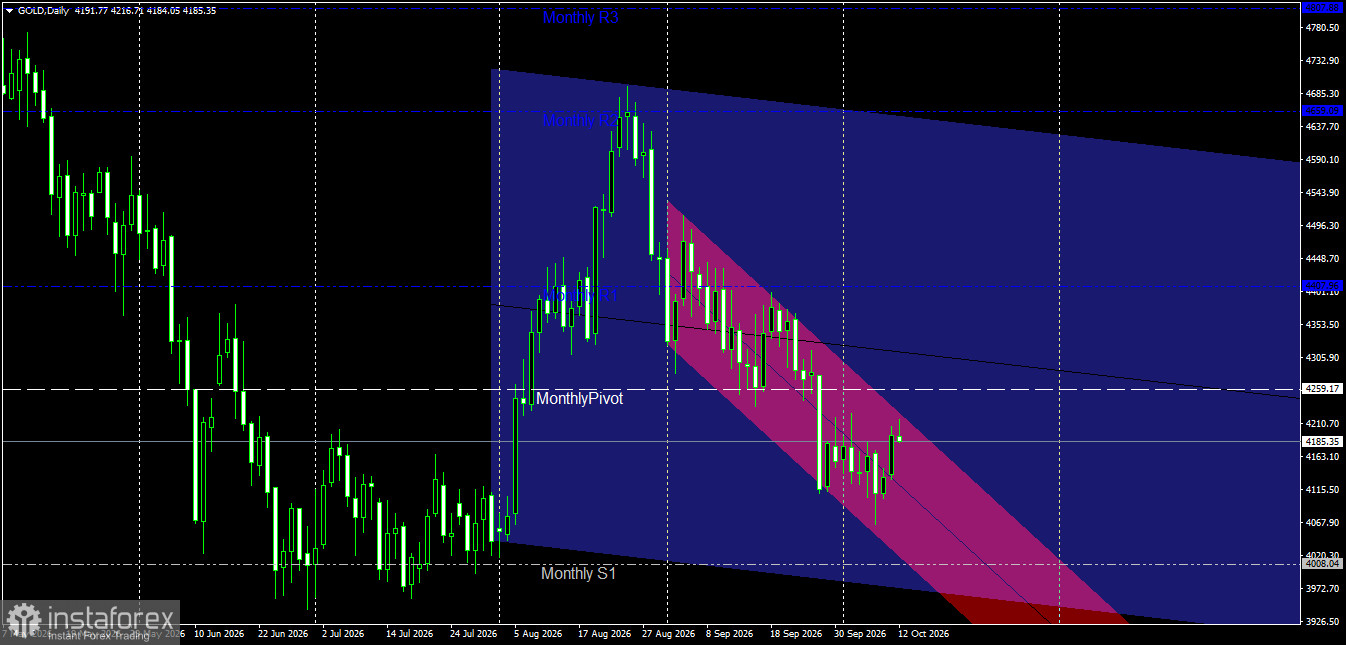
Price Channel Structure: The price is moving within a primary bearish channel (blue) and a steeper bearish sub-channel (pink/red). While the price recently rebounded from an intraday low near the first monthly support level (Monthly S1) at 4008.04, this recovery remains confined to the bearish corrective path as long as the price stays within the sub-channel.
Interaction with Monthly Pivot Levels: The price is currently trading below the monthly pivot point at 4259.17 and the first monthly resistance level (Monthly R1) at 4407.96. Trading below the monthly pivot reinforces the bearish outlook, keeping sellers in control unless this barrier is breached with a confirmed daily close. Pivotal Support and Resistance Levels
Key Resistance Levels:
First Resistance: 4210.70 – 4259.17 (Upper limit of the sub-channel and the Monthly Pivot point).
Second Resistance: 4353.50 (Intermediate technical level).
Pivotal Resistance: 4407.96 (Monthly R1 resistance level).
Key Support Levels:
First Support: 4115.50 – 4163.10 (Recent intraday low zones).
Second Support: 4008.04 (Monthly S1 support level).
Key Support: 3926.50 (Lower limit of the main bearish channel).
Price Action Outlook and Trading Recommendations
Bearish Scenario (Primary):
A bearish trend is the most likely outcome on the daily timeframe as long as the price remains below the Monthly Pivot level of 4259.17 and within the boundaries of the pink channel.
Recommendation: Sell upon a retest of the nearby resistance zones (4210.70 – 4259.17) if bearish reversal signals appear.
Technical Targets: Target the 4115.50 level as the first objective, extending toward the Monthly S1 support at 4008.04.
Stop Loss: A daily close above the 4259.17 level. Bullish Corrective Scenario (Alternative):
This scenario is triggered if the price breaks above the upper boundary of the sub-channel and the monthly pivot point at 4259.17, subsequently stabilizing above this level with a strong daily candle.
Confirmation Condition: Breaking above 4259.17 and closing above it.
Technical Targets: A move towards 4305.90, followed by the 4353.50 level and the first monthly resistance level at 4407.96.
Risk Management
Trading on the daily timeframe requires strict adherence to risk management principles and avoiding counter-trend trading without confirmation, while limiting risk to between 1% and 2% of the total trading account per trade.
The H1 chart for Gold (GOLD) displays strong bullish price action; the price is currently trading around the 4184.23 level, maintaining gains following a breakout above pivotal levels. Trading remains established within accelerating bullish channels, supporting the continuation of the short-term upward trend.
Technical Analysis and Price Action
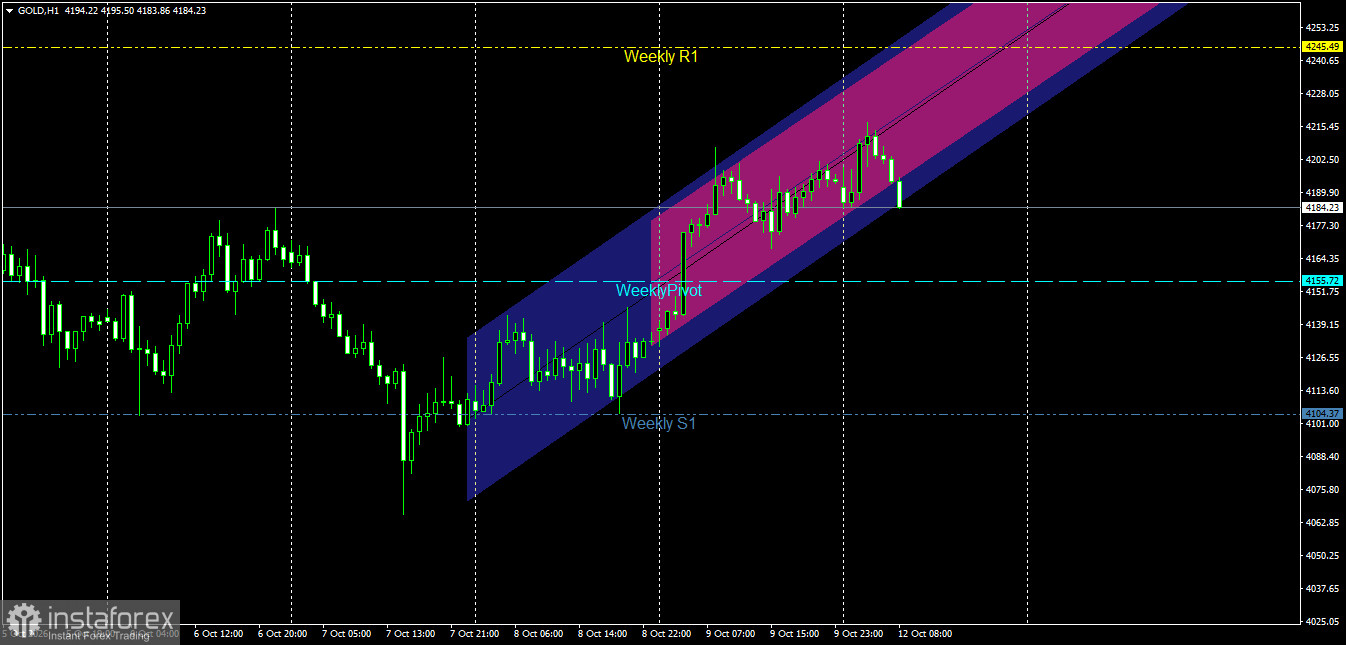
Bullish Channel Structure: The price is clearly moving within a primary bullish channel (blue), reflecting a positive shift in the intraday structure, while overlapping with a high-momentum sub-channel (pink/red). Notably, the price is testing the midpoint of the bullish channel after pulling back from recent intraday highs, demonstrating buyer resilience and an intent to extend the rally.
Interaction with Pivot Levels: Gold successfully broke above the Weekly Pivot point at 4155.72 and stabilized there, transforming the level from resistance into a solid support base. Furthermore, the price surpassed the previous Weekly S1 support level (4104.37) and surged toward higher levels, targeting the Weekly R1 resistance zone.
Key Support and Resistance Levels
Key Resistance Levels:
Resistance 1: 4202.50 – 4215.45 (recent intraday highs and the upper boundary of the sub-channel). Second Resistance: 4245.49 (Weekly R1).
Pivot Resistance: 4265.00 and above (contingent on sustained strong positive momentum).
Key Support Levels:
First Support: 4177.30 – 4184.23 (current fluctuation zones and the lower boundary of the sub-channel).
Second Support: 4155.72 (Weekly Pivot).
Key Support: 4104.37 (Weekly S1).
Price Action Outlook and Trading Recommendations
Bullish Scenario (Primary):
A positive trend dominates the intraday timeframe as long as the price holds above the Weekly Pivot (4155.72) and, more importantly, above the current support zones near 4177.30.
Recommendation: Buy upon a positive rebound from current support levels, or upon a retest of the Weekly Pivot in the event of a temporary corrective pullback.
Technical Targets: Target the 4202.50 zone first, followed by an extension toward the first weekly resistance at 4245.49.
Stop Loss: A one-hour candle close below 4150.00.
Bearish Corrective Scenario (Alternative):
Triggered if the price breaks below the Weekly Pivot (4155.72) and stabilizes there with a strong one-hour candle. Confirmation Condition: A break below 4155.72 and an exit from the minor rising channel.
Technical Targets: Paving the way for a bearish correction targeting the 4120.00 level, followed by the first weekly support at 4104.37.
Risk Management
Trading during periods of strong bullish momentum requires strict adherence to placing stop-loss orders to protect profits from sudden volatility, while maintaining capital management in line with professional standards (a maximum risk of 1% to 2% per trade).


